
|
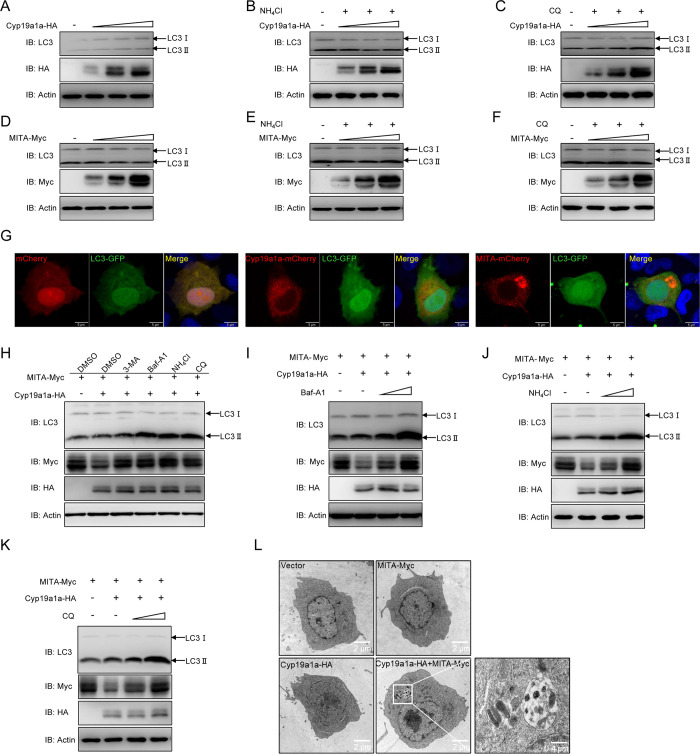
Fig. 6
(A-F) EPC cells were transfected with Cyp19a1a-HA (0.5, 1, or 2 μg) (A-C) or MITA-Myc (0.5, 1, or 2 μg) (D-F). At 18 h post-transfection, the cells were treated with DMSO, NH4Cl (20 mM), or CQ (100 μM) for 6 h. Then, the cells were harvested for IB with the indicated Abs. (G) EPC cells were co-transfected with 1 μg pCS2-mCherry, Cyp19a1a-mCherry, or MITA-mCherry plus 1 μg LC3-GFP. After 24 h, the cells were fixed and observed by confocal microscopy. Red signals represent overexpressed Cyp19a1a or MITA, green signals represent overexpressed LC3 (original magnification 63×; oil immersion objective). Scale bar, 10 μm. (H) EPC cells were co-transfected the indicated plasmids. At 18 h post-transfection, the cells were treated with DMSO, 3-MA (2 mM), Baf-A1 (100 nM), NH4Cl (20 mM), or CQ (100 μM) for 6 h. The cell lysates were subjected to IB with the anti-LC3, anti-Myc, anti-HA, and anti-β-actin Abs, respectively. (I-K) EPC cells were co-transfected the indicated plasmids. At 18 h post-transfection, the cells were treated with DMSO, Baf-A1 (50 or 100 nM), NH4Cl (10 or 20 mM), or CQ (50 or 100 μM) for 6 h. The cell lysates were subjected to IB with the indicated Abs. (L) EPC cells were transfected with indicated plasmids for 24 h. Then the cells were analyzed for autophagosome formation using a transmission electron microscope. Images on the right correspond to the squared zoomed images in each panel. Scale bar, 2 μm.