
- Title
-
5-Azacytidine Downregulates the Proliferation and Migration of Hepatocellular Carcinoma Cells In Vitro and In Vivo by Targeting miR-139-5p/ROCK2 Pathway
- Authors
- Tonon, F., Cemazar, M., Kamensek, U., Zennaro, C., Pozzato, G., Caserta, S., Ascione, F., Grassi, M., Guido, S., Ferrari, C., Cansolino, L., Trotta, F., Kuzmanov, B.G., Forte, G., Martino, F., Perrone, F., Bomben, R., Gattei, V., Elvassore, N., Murano, E., Truong, N.H., Olson, M., Farra, R., Grassi, G., Dapas, B.
- Source
- Full text @ Cancers
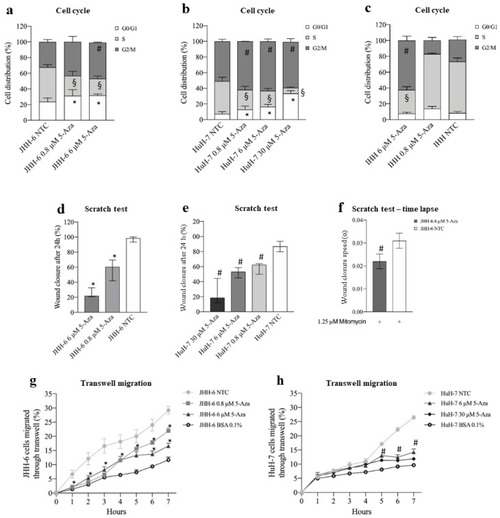
Figure 1. Effects of 5-Aza on cell growth and migration. (a–c) Cell cycle phase distribution. Data, expressed as mean ± SEM, are reported as percentage. JHH-6 NTC G0/G1 vs. JHH-6 0.8/6 μM 5-Aza G0/G1, * p < 0.021; JHH-6 NTC S vs. JHH-6 0.8/6 μM S, § p < 0.0087; JHH-6 NTC G2/M vs. JHH-6 0.8/6 μM G2/M, # p < 0.011, n = 5. HuH-7 NTC G0/G1 vs. HuH-7 0.8/6/30 5-Aza μM G0/G1, * p < 0.022; HuH-7 NTC S vs. HuH-7 0.8/6/30 5-Aza μM S, § p < 0.024; HuH-7 NTC G2/M vs. HuH-7 0.8/6/30 μM G2/M, # p < 0.045, n = 3. IHH NTC S vs. IHH 6 μM 5-Aza S, § p < 0.0003; IHH NTC G2/M vs. IHH 6 μM 5-Aza G2/M, # p = 0.0012, n = 3. (d,e) Cell migration, evaluated by scratch assay. Data, expressed as percentage, are presented as median with interquartile range; JHH-6/NTC vs. JHH-6 0.8/6 5-Aza μM, * p = 0.0012, n = 6; HuH-7/NTC vs. HuH-7 0.8/6/30 5-Aza μM, # p = 0.0002, n = 8. (f) Wound healing experiments were analyzed by measuring the reduction in the area of the cell-free region over time (A), normalized with respect to its initial value (A0); the slope of the linear range of the A/A0 vs. t curve can be considered a measure of the wound closure velocity α (h−1); JHH-6/NTC/mitomycin vs. JHH-6/6 μM 5-Aza/mitomycin, # p = 0.012, n = 5. (g,h) Effects on cell migration, evaluated by FATIMA assay. Data, expressed as mean ± SEM, are reported as percentage. JHH-6/NTC vs. JHH-6 0.8/6 5-Aza μM, * p < 0.046, n = 5; HuH-7/NTC vs. HuH-7 6/30 5-Aza μM, # p < 0.014, n = 4; BSA: bovine serum albumin (control-treated cells). |
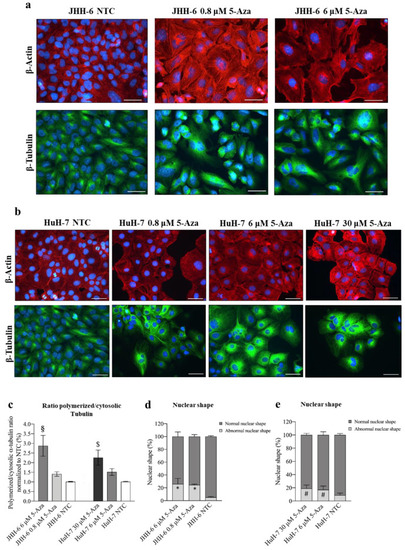
Figure 2. Effects of 5-Aza on cell cytoskeleton. (a,b) Immunostaining of β-actin and β-tubulin in JHH-6 and HuH-7 cells, respectively. Images were acquired with a Leica DM 2000 microscope. Red = β-actin; green = β-tubulin; blue = DAPI. Magnification 40X (bar = 100 μm). (c) Ratio of polymerized/cytosolic α-tubulin in 5-Aza-treated vs. non-treated cells (NTC); data are expressed as mean ± SEM; JHH-6 NTC vs. JHH-6/5-Aza, § p= 0.04; HuH-7 NTC vs. HuH-7/5-Aza, $ p= 0.045, n = 3. (d,e) Quantification of the number of altered nuclei shape in 5-Aza-treated vs. non-treated cells. Data, expressed as mean ± SEM, are reported as percentage normalized to the average of non-treated cells (NTC). Abnormal nuclei in JHH6/NTC vs. JHH6/0,8-6 μM, * p < 0.0001 n = 60; HuH7/NTC vs. HuH7/6-30 μM, # p < 0.001 n = 60. |
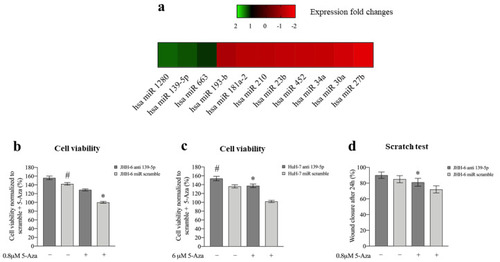
Figure 3. Effects of 5-Aza on miR expression and effects of miR-139-5p on cell viability and migration. (a) Differentially expressed miRs following 6 μM 5-Aza treatments in JHH-6 evaluated by microarray analysis. (b) Viability of JHH-6 treated with both antagomiR-139-5p (100 nM) and 5-Aza. Data, normalized to the average of JHH-6 scr + 5-Aza, are represented as mean ± SEM, n = 3; JHH-6 antagomiR-139-5p vs. JHH-6 scr, # p = 0.0123; JHH-6 antagomiR-139-5p + 5-Aza vs. JHH-6 scr + 5-Aza, * p = 0.0001. (c) Viability of HuH-7 treated by both antagomiR-139-5p and 5-Aza. Data, normalized to the average of HuH-7 scr + 5-Aza, are represented as mean ± SEM, n = 3. HuH-7 antagomiR-139-5p vs. HuH-7 scr, # p = 0.0065; HuH-7 antagomiR-139-5p + 5-Aza vs. HuH-7 scr + 5-Aza, * p = 0.0001. (d) Migration of JHH-6 treated with both antagomiR-139-5p and 5-Aza. JHH-6 antagomiR-139-5p + 5-Aza vs. JHH-6 miR scr + 5-Aza, * p = 0.002. Data are presented as mean ± SEM, n = 3. |
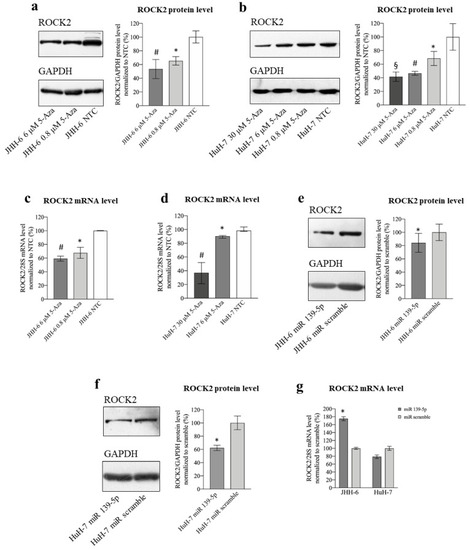
Figure 4. Effects of 5-Aza and miR-139-5p on ROCK2 expression. (a) Effects of 5-Aza on ROCK2 protein level in JHH-6. Left, representative Western blot (GAPDH was introduced for normalization); right, data normalized to GAPDH levels and to the average of non-treated cells (NTC) are reported in % as mean ± SEM, n = 6; NTC vs. 0.8 μM, * p = 0.0398; NTC vs. 6 μM, # p = 0.0177. (b) Effects of 5-Aza on ROCK2 protein level in HuH-7. Left, representative Western blot; right, data normalized to GAPDH levels and to the average of NTC are reported in % as mean ± SEM, n = 4; NTC vs. 0.8 μM, * p = 0.0135; NTC vs. 6 μM, # p = 0.0081; NTC vs. 30 μM, § p = 0.038. (c) Effects of 5-Aza on ROCK2 mRNA level in JHH-6. Data normalized to 28S levels and to the average of NTC are reported in % as mean ± SEM, n = 6; NTC vs. 0.8 μM, * p = 0.0025; NTC vs. 6 μM, # p = 0.0001. (d) Effects of 5-Aza on ROCK2 mRNA level in HuH-7. Data normalized to 28S levels and to the average of NTC are reported in % as median with interquartile range, n = 6; NTC vs. 6 μM, * p = 0.0022; NTC vs. 30 μM, # p = 0.002. (e) Effects of miR-139-5p on ROCK2 protein level in JHH-6. Left, representative Western blot; right, data normalized to GAPDH levels and to the average of scr (scrambled miR treated cells) are reported in % as mean ± SEM, n = 5; scr vs. miR-139-5p, * p = 0.0071. (f) Effects of miR-139-5p on ROCK2 protein level in HuH-7. Left, representative Western blot; right, data normalized to GAPDH levels and to the average of scr are reported in % as mean ± SEM, n = 5; scr vs. miR-139-5p, * p = 0.0268. (g) Effects of miR-139-5p on ROCK2 mRNA level in JHH-6 and HuH-7. Data normalized to 28S levels and to the average of scr are reported in % as mean ± SEM, n = 3; scr vs. miR-139-5p, * p = 0.04. |
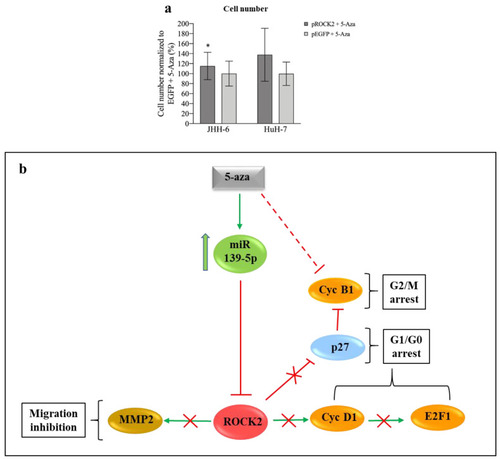
Figure 5. Phenotypic effects of ROCK2 overexpression/downregulation and miR-139-5p/ROCK2 pathway. (a) ROCK2 overexpression and 5-Aza treatment. Left: data in %, normalized to the average of JHH-6 overexpressing EGFP (enhanced green fluorescent protein, control cells) + 5-Aza treatment (0.8 μM), are expressed as mean ± SEM, n = 4; JHH-6 overexpressing ROCK2 + 5-Aza vs. JHH-6 overexpressing EGFP + 5-Aza, * p = 0.035. Right: HuH-7 overexpressing ROCK2 + 5-Aza vs. HuH-7 overexpressing EGFP + 5-Aza (6 μM); data in %, normalized to the average of HuH-7 overexpressing EGFP + 5-Aza, are expressed as mean ± SEM, n = 3. (b) Molecular pathways regulated by miR-139-5p and effects on cell migration and proliferation: 5-Aza upregulates miR-139-5p, which in turn leads to the downregulation of ROCK2/cyclin D1/E2F1/cyclin B1/MMP-2 and the upregulation of p27kip1; this results in G1/G0-G2/M cell cycle arrest and in the impairment of cell migration. |
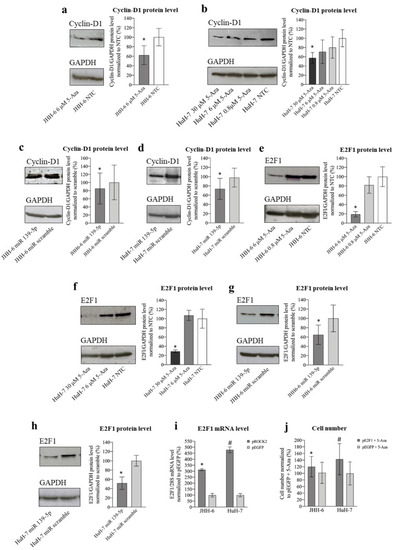
Effects of 5-Aza and miR-139-5p on cyclin D1 and E2F1 expression. ( |
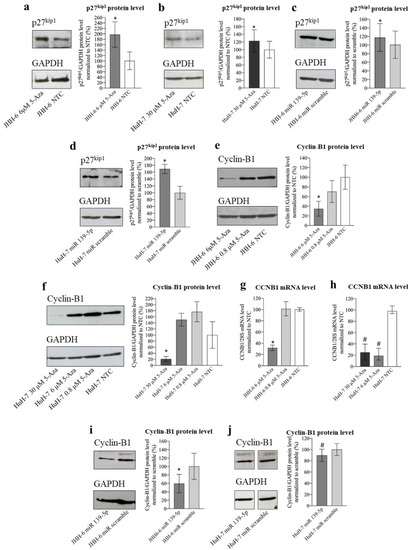
Effects of 5-Aza and miR-139-5p on p27kip and cyclin B1 expression. ( |
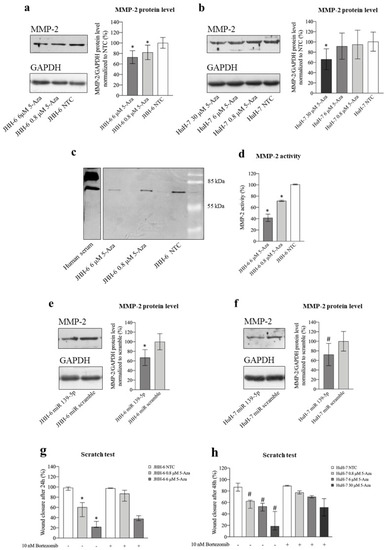
Figure 8. Effects of 5-Aza and miR-139-5p on MMP-2. (a) Effects of 5-Aza on MMP-2 protein level in JHH-6. Left, representative Western blot (GAPDH was introduced for normalization); right, data normalized to GAPDH levels and to the average of non-treated cells (NTC) are reported in % as mean ± SEM, n = 7; NTC vs. 0.8/6 μM, * p < 0.048. (b) Effects of 5-Aza on MMP-2 protein level in HuH-7. Left, representative Western blot; right, data normalized to GAPDH levels and to the average of NTC are reported in % as mean ± SEM, n = 5; NTC vs. 30 μM, * p = 0.016. (c,d) Evaluation of MMP-2 activity by zymography; left, representative zymogram obtained from the analysis of JHH-6 supernatants is shown; right, data are reported in % as mean ± SEM, n = 6; NTC vs. 0.8/6 μM, * p < 0.0001. (e,f) Effects of miR-139-5p on MMP-2 protein level in JHH-6 and HuH-7, respectively. In each panel, a representative Western blot is shown on the left; right, data normalized to GAPDH levels and to the average of scr (scrambled miR treated cells) are reported in % as mean ± SEM, n = 4; JHH-6/scr vs. JHH-6/miR-139-5p-treated cells, * p = 0.041; HuH-7/scr vs. HuH-7/miR-139-5p-treated cells, # p = 0.0031. (g,h) Scratch assay quantification in JHH-6 and HuH-7 cells treated by 5-Aza with or without the combined treatment with bortezomib. Data are represented as median with interquartile range, n = 4; JHH-6/0.8/6 μM aza vs. JHH-6/0.8-6 μM aza + bortezomib, * p < 0.0314; HuH-7/0.8-6-30 μM aza vs. HuH-7/0.8-6-30 μM aza + bortezomib, # p < 0.04. |
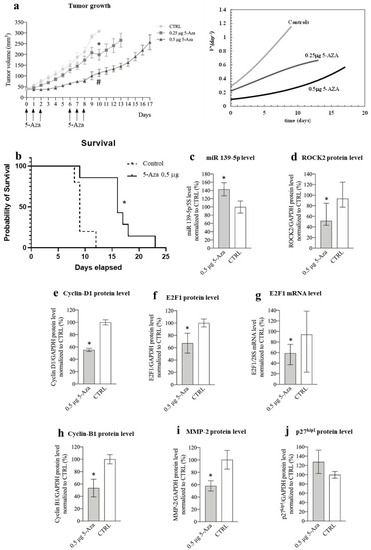
Figure 9. Phenotypic and molecular effects of 5-Aza in the xenograft mouse model of HCC. (a) Effects of 5-Aza on tumor growth. Left: the arrows indicate the administration times for 5-Aza (either 0.25 μg or 0.5 μg per injection); data are reported in mm3 as mean ± SEM, 0.5 μg 5-Aza/day1-10 vs. CTRL (saline solution treated animals) days 1-10, # p = 0.0022; 0,25μg 5-Aza/day1-10 vs. CTRL day/1-10, * p = 0.0036. Right: Equation (3) best fit to tumor growth data determines the dimensionless tumor speed velocity VD+ (Equation (4)) expressing the number of cells generated by each original cell after time. (b) Kaplan–Meier curve; mice were treated either with 0.5 μg 5-Aza/day or with saline solution (CTRL), log-rank (Mantel–Cox) test, * p = 0.03, n = 6. (c) miR-139-5p expression level; data normalized to 5s rRNA content and to the average of CTRL are reported in % as mean ± SEM, CTRL vs. 0.5 μg 5-Aza, * p= 0.047, n = 6. (d) Effects of 5-Aza on ROCK2 protein level; data normalized to GAPDH levels and to the average of CTRL are reported in % as median with interquartile range, n = 6; CTRL vs. 0.5 μg 5-Aza, * p = 0.041, n = 6. (e) Effects of 5-Aza on cyclin D1 protein level; data normalized to GAPDH levels and to the average of CTRL are reported in % as mean ± SEM, n = 6; CTRL vs. 0.5 μg 5-Aza, * p = 0.0001. (f) Effects of 5-Aza on E2F1 protein level; data normalized to GAPDH levels and to the average of CTRL are reported in % as mean ± SEM, n = 6; CTRL vs. 0.5 μg 5-Aza, * p = 0.047. (g) Effects of 5-Aza on E2F1 mRNA level; data normalized to 28S levels and to the average of CTRL are reported in % as median with interquartile range, CTRL vs. 0.5 μg 5-Aza, * p = 0.041, n = 6. (h) Effects of 5-Aza on cyclin B1 protein level; data normalized to GAPDH levels and to the average of CTRL are reported in % as mean ± SEM, n = 5; CTRL vs. 0.5 μg 5-Aza, * p = 0.002. (i) Effects of 5-Aza on MMP-2 protein level; data normalized to GAPDH levels and to the average of CTRL are reported in % as mean ± SEM, n = 6; CTRL vs. 0.5 μg 5-Aza, * p = 0.045. (j) Effects of 5-Aza on p27kip protein level; data normalized to GAPDH levels and to the average of CTRL are reported in % as mean ± SEM, n = 5. |
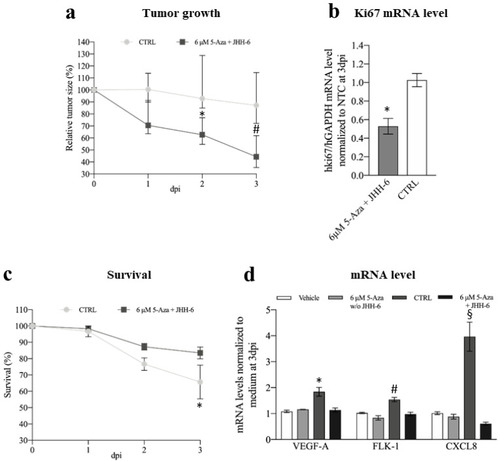
Figure 10. Phenotypic and molecular effects of 5-Aza in the xenograft zebrafish model of HCC. (a) Comparison of tumor growth between 5-Aza-treated and control zebrafish inoculated with JHH-6; data are reported in % as median with interquartile range, CTRL 2 days post-injection (dpi) vs. 6 μM 5-Aza 2dpi, * p = 0.025; CTRL 3 dpi vs. 6 μM 5-Aza 3dpi, # p = 0.0015, n = 45. (b) Effects of 5-Aza on human Ki67 mRNA level; data, normalized to GAPDH levels and to the average of CTRL, are reported as mean ± SEM, CTRL vs. 0.5 μg 5-Aza * p = 0.0002, n = 12. (c) Kaplan–Meier curve; zebrafish were treated either with 0.5 μg 5-Aza/day or with saline solution (CTRL), log-rank (Mantel–Cox) test, * p = 0.0252, n = 45 for each group; % of animal survival is expressed as mean ± SEM, n = 45. (d) Effects of 5-Aza on the zebrafish VEGFA, FLK-1, and CXCL8 mRNA levels (vehicle: animal not injected with JHH-6 and treated with saline; 6 μM 5-Aza w/o JHH-6: animal not injected with JHH-6 and treated with 5-Aza; CTRL: animal injected with JHH-6 and treated with saline; 6 μM 5-Aza + JHH-6: animal injected with JHH-6 and treated with 5-Aza). Data, normalized to GAPDH levels and to the average of CTRL at 3dpi, are reported as mean ± SEM. VEGFA: CTRL vs. 6 μM 5-Aza + JHH-6, * p = 0.0359; FLK-1: CTRL vs. 6 μM 5-Aza + JHH-6, # p = 0.0495; CXCL8: CTRL vs. 6 μM 5-Aza + JHH-6, § p < 0.0001, n = 4. PHENOTYPE:
|