
Figure 3
- ID
- ZDB-IMAGE-220416-70
- Publication
- Tonon et al., 2022 - 5-Azacytidine Downregulates the Proliferation and Migration of Hepatocellular Carcinoma Cells In Vitro and In Vivo by Targeting miR-139-5p/ROCK2 Pathway
- All Figures
- Figures for Tonon et al., 2022
|
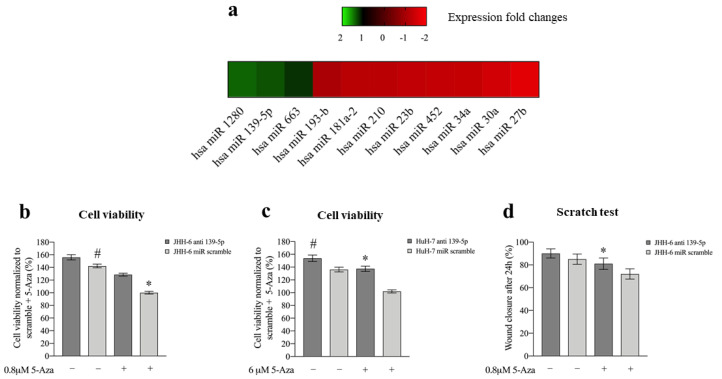
Figure 3 Figure 3. Effects of 5-Aza on miR expression and effects of miR-139-5p on cell viability and migration. (a) Differentially expressed miRs following 6 μM 5-Aza treatments in JHH-6 evaluated by microarray analysis. (b) Viability of JHH-6 treated with both antagomiR-139-5p (100 nM) and 5-Aza. Data, normalized to the average of JHH-6 scr + 5-Aza, are represented as mean ± SEM, n = 3; JHH-6 antagomiR-139-5p vs. JHH-6 scr, # p = 0.0123; JHH-6 antagomiR-139-5p + 5-Aza vs. JHH-6 scr + 5-Aza, * p = 0.0001. (c) Viability of HuH-7 treated by both antagomiR-139-5p and 5-Aza. Data, normalized to the average of HuH-7 scr + 5-Aza, are represented as mean ± SEM, n = 3. HuH-7 antagomiR-139-5p vs. HuH-7 scr, # p = 0.0065; HuH-7 antagomiR-139-5p + 5-Aza vs. HuH-7 scr + 5-Aza, * p = 0.0001. (d) Migration of JHH-6 treated with both antagomiR-139-5p and 5-Aza. JHH-6 antagomiR-139-5p + 5-Aza vs. JHH-6 miR scr + 5-Aza, * p = 0.002. Data are presented as mean ± SEM, n = 3.