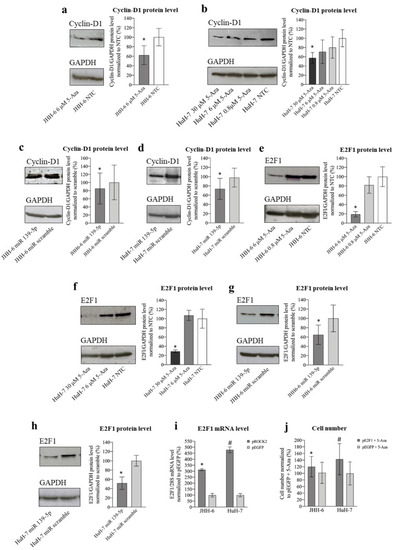
Effects of 5-Aza and miR-139-5p on cyclin D1 and E2F1 expression. (a) Effects of 5-Aza on cyclin D1 protein level in JHH-6. Left, representative Western blot (GAPDH was introduced for normalization); right, data normalized to GAPDH levels and to the average of non-treated cells (NTC) are reported in % as mean ± SEM, n = 5; NTC vs./6 μM, * p = 0.0005. (b) Effects of 5-Aza on cyclin D1 protein level in HuH-7. Left, representative Western blot; right, data normalized to GAPDH levels and to the average of NTC are reported in % as mean ± SEM, n = 6; NTC vs. 30 μM, * p = 0.048. (c) Effects of miR-139-5p on cyclin D1 protein level in JHH-6. Left, representative Western blot; right, data normalized to GAPDH levels and to the average of scr (scrambled miR treated cells) are reported in % as mean ± SEM, n = 4; scr vs. miR-139-5p-treated cells, * p = 0.048. (d) Effects of miR-139-5p on cyclin D1 protein level in HuH-7. Left, representative Western blot; right, data normalized to GAPDH levels and to the average of scr are reported in % as mean ± SEM, n = 5; scr vs. miR-139-5p-treated cells, * p = 0.045. (e) Effects of 5-Aza on E2F1 protein level in JHH-6. Left, representative Western blot; right, data normalized to GAPDH levels and to the average of NTC are reported in % as mean ± SEM, n = 3; NTC vs. 6 μM, * p = 0.048. (f) Effects of 5-Aza on E2F1 protein level in HuH-7. Left, representative Western blot; right, data normalized to GAPDH levels and to the average of NTC are reported in % as mean ± SEM, n = 3; NTC vs. 30 μM, * p = 0.044. (g) Effects of miR-139-5p on E2F1 protein level in JHH-6. Left, representative Western blot; right, data normalized to GAPDH levels and to the average of scr are reported in % as mean ± SEM, n = 3; scr vs. miR-139-5p-treated cells, * p = 0.04. (h) Effects of miR-139-5p on E2F1 protein level in HuH-7. Left, representative Western blot; right, data normalized to GAPDH levels and to the average of scr are reported in % as mean ± SEM, n = 3; scr vs. miR-139-5p-treated cells, * p = 0.015. (i) E2F1 mRNA levels following ROCK2 overexpression. Left JHH-6, data normalized to 28S levels and to the average of pEGFP (control plasmid, cells overexpressing EGFP) are reported in % as mean ± SEM, n = 4; pEGFP vs. pROCK2 (cells overexpressing ROCK2), * p = 0.028. Right: HuH-7, data normalized to 28S levels and to the average of pEGFP are reported in % as mean ± SEM, n = 4; pEGFP vs. pROCK2, #p = 0.028. (j) Effects of E2F1 overexpression on the number of 5-Aza-treated cells. Left: data in %, normalized to the average of JHH-6 overexpressing EGFP + 5-Aza treatment, are expressed as mean ± SEM, n = 4; JHH-6 overexpressing E2F1 + 5-Aza vs. JHH-6 overexpressing EGFP + 5-Aza, * p = 0.047. Right: data in %, normalized to the average of HuH-7 overexpressing EGFP + 5-Aza, are expressed as mean ± SEM, n = 4; HuH-7 overexpressing E2F1 + 5-Aza vs. HuH-7 overexpressing EGFP + 5-Aza, #p = 0.032.
|
