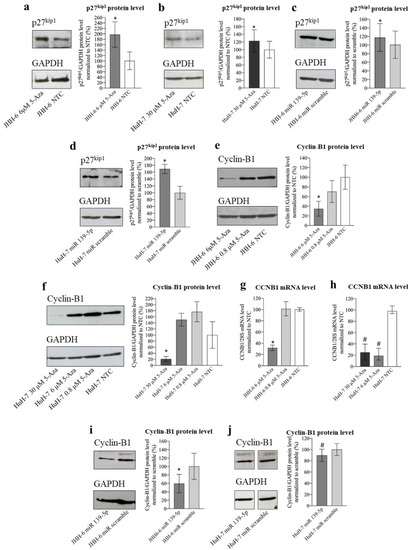
Effects of 5-Aza and miR-139-5p on p27kip and cyclin B1 expression. (a) Effects of 5-Aza on p27kip1 protein level in JHH-6. Left, representative Western blot (GAPDH was introduced for normalization); right, data normalized to GAPDH levels and to the average of non-treated cells (NTC) are reported in % as mean ± SEM, n = 6; NTC v.s 6 μM, * p = 0.031. (b) Effects of 5-Aza on p27kip1 protein level in HuH-7. Left, representative Western blot; right, data normalized to GAPDH levels and to the average of NTC are reported in % as mean ± SEM, n = 3; NTC vs. 30 μM, * p = 0.018. (c) Effects of miR-139-5p on p27kip1 protein level in JHH-6. Left, representative Western blot; right, data normalized to GAPDH levels and to the average of scr (scrambled miR treated cells) are reported in % as mean ± SEM, n = 5; scr vs. miR-139-5p-treated cells, * p = 0.01. (d) Effects of miR-139-5p on p27kip1 protein level in HuH-7. Left, representative Western blot; right, data normalized to GAPDH levels and to the average of scr are reported in % as mean ± SEM, n = 3; scr vs. miR-139-5p-treated cells, * p = 0.025. (e) Effects of 5-Aza on cyclin B1 protein level in JHH-6. Left, representative Western blot; right, data normalized to GAPDH levels and to the average of NTC are reported in % as mean ± SEM, n = 6; NTC vs. 6 μM, * p = 0.044. (f) Effects of 5-Aza on cyclin B1 protein level in HuH-7. Left, representative Western blot; right, data normalized to GAPDH levels and to the average of NTC are reported in % as mean ± SEM, n = 4; NTC vs. 30 μM, * p = 0.042. (g,h) Effects of 5-Aza on CCNB1 mRNA level in JHH-6 and HuH-7, respectively. Data normalized to 28S levels and to the average of NTC are reported in % as median with interquartile range, n = 6; JHH-6/NTC vs. JHH-6/6 μM 5-Aza, * p = 0.0001; HuH-7/NTC vs. HuH-7/6-30 μM 5-Aza, #p < 0.0022. (i,j) Effects of miR-139-5p on cyclin B1 protein level in JHH-6 and HuH-7, respectively. In each panel, a representative Western blot is presented on the left; right, data normalized to GAPDH levels and to the average of scr are reported in % as mean ± SEM, n = 4; JHH-6/scr vs. JHH-6/miR-139-5p-treated cells, * p = 0.042, HuH-7/scr vs. HuH-7/miR-139-5p-treated cells, #p = 0.0002.
|
