
Figure 8
- ID
- ZDB-FIG-220416-30
- Publication
- Tonon et al., 2022 - 5-Azacytidine Downregulates the Proliferation and Migration of Hepatocellular Carcinoma Cells In Vitro and In Vivo by Targeting miR-139-5p/ROCK2 Pathway
- Other Figures
- All Figure Page
- Back to All Figure Page
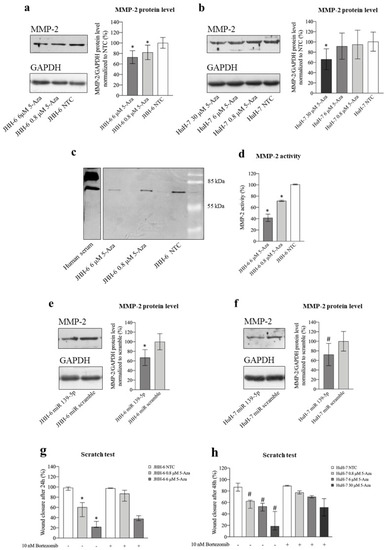
Figure 8. Effects of 5-Aza and miR-139-5p on MMP-2. (a) Effects of 5-Aza on MMP-2 protein level in JHH-6. Left, representative Western blot (GAPDH was introduced for normalization); right, data normalized to GAPDH levels and to the average of non-treated cells (NTC) are reported in % as mean ± SEM, n = 7; NTC vs. 0.8/6 μM, * p < 0.048. (b) Effects of 5-Aza on MMP-2 protein level in HuH-7. Left, representative Western blot; right, data normalized to GAPDH levels and to the average of NTC are reported in % as mean ± SEM, n = 5; NTC vs. 30 μM, * p = 0.016. (c,d) Evaluation of MMP-2 activity by zymography; left, representative zymogram obtained from the analysis of JHH-6 supernatants is shown; right, data are reported in % as mean ± SEM, n = 6; NTC vs. 0.8/6 μM, * p < 0.0001. (e,f) Effects of miR-139-5p on MMP-2 protein level in JHH-6 and HuH-7, respectively. In each panel, a representative Western blot is shown on the left; right, data normalized to GAPDH levels and to the average of scr (scrambled miR treated cells) are reported in % as mean ± SEM, n = 4; JHH-6/scr vs. JHH-6/miR-139-5p-treated cells, * p = 0.041; HuH-7/scr vs. HuH-7/miR-139-5p-treated cells, # p = 0.0031. (g,h) Scratch assay quantification in JHH-6 and HuH-7 cells treated by 5-Aza with or without the combined treatment with bortezomib. Data are represented as median with interquartile range, n = 4; JHH-6/0.8/6 μM aza vs. JHH-6/0.8-6 μM aza + bortezomib, * p < 0.0314; HuH-7/0.8-6-30 μM aza vs. HuH-7/0.8-6-30 μM aza + bortezomib, # p < 0.04. |