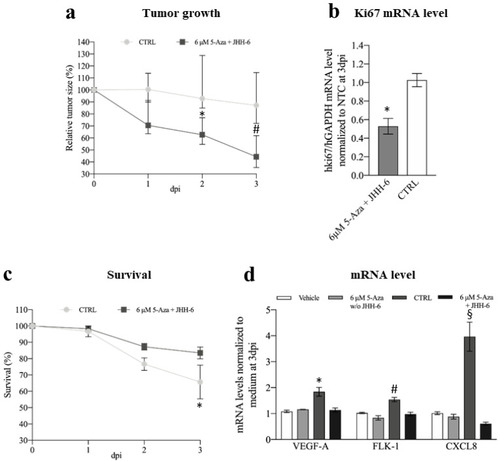
Figure 10. Phenotypic and molecular effects of 5-Aza in the xenograft zebrafish model of HCC. (a) Comparison of tumor growth between 5-Aza-treated and control zebrafish inoculated with JHH-6; data are reported in % as median with interquartile range, CTRL 2 days post-injection (dpi) vs. 6 μM 5-Aza 2dpi, * p = 0.025; CTRL 3 dpi vs. 6 μM 5-Aza 3dpi, # p = 0.0015, n = 45. (b) Effects of 5-Aza on human Ki67 mRNA level; data, normalized to GAPDH levels and to the average of CTRL, are reported as mean ± SEM, CTRL vs. 0.5 μg 5-Aza * p = 0.0002, n = 12. (c) Kaplan–Meier curve; zebrafish were treated either with 0.5 μg 5-Aza/day or with saline solution (CTRL), log-rank (Mantel–Cox) test, * p = 0.0252, n = 45 for each group; % of animal survival is expressed as mean ± SEM, n = 45. (d) Effects of 5-Aza on the zebrafish VEGFA, FLK-1, and CXCL8 mRNA levels (vehicle: animal not injected with JHH-6 and treated with saline; 6 μM 5-Aza w/o JHH-6: animal not injected with JHH-6 and treated with 5-Aza; CTRL: animal injected with JHH-6 and treated with saline; 6 μM 5-Aza + JHH-6: animal injected with JHH-6 and treated with 5-Aza). Data, normalized to GAPDH levels and to the average of CTRL at 3dpi, are reported as mean ± SEM. VEGFA: CTRL vs. 6 μM 5-Aza + JHH-6, * p = 0.0359; FLK-1: CTRL vs. 6 μM 5-Aza + JHH-6, # p = 0.0495; CXCL8: CTRL vs. 6 μM 5-Aza + JHH-6, § p < 0.0001, n = 4.
|
