
- Title
-
Evaluation of Effects of Ractopamine on Cardiovascular, Respiratory, and Locomotory Physiology in Animal Model Zebrafish Larvae
- Authors
- Abbas, K., Saputra, F., Suryanto, M.E., Lai, Y.H., Huang, J.C., Yu, W.H., Chen, K.H., Lin, Y.T., Hsiao, C.D.
- Source
- Full text @ Cells
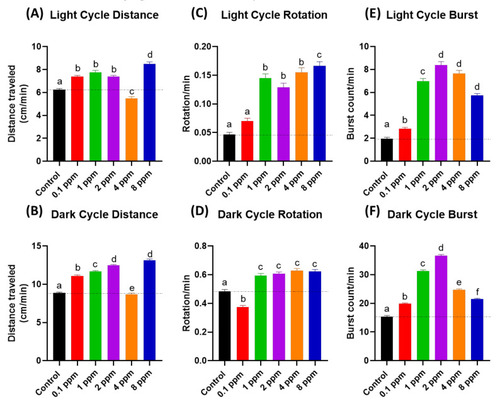
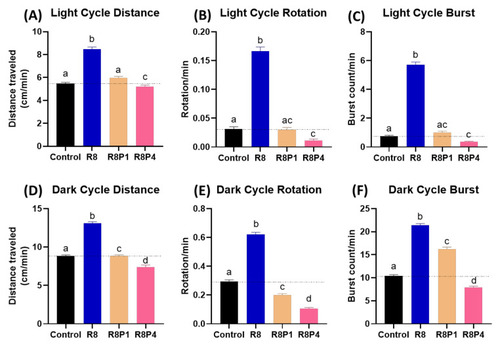
Figure 1. The RAC effect on zebrafish photomotor activities. (A) Total distance traveled of zebrafish larvae after 24-h incubation to different doses of RAC in (A) light cycle and (B) dark cycle. Total rotation movement of zebrafish larvae after 24-h incubation to different doses of RAC in (C) light cycle and (D) dark cycle. Total burst movement of zebrafish larvae after exposed to different doses of RAC for 24 h in (E) light cycle and (F) dark cycle. The data were shown as the Mean ± SEM and analyzed by Kruskal–Wallis test followed with Dunn’s multiple comparisons test. Different letters a, b, c, d, e, and f above columns indicate significant statistical differences with p < 0.05 (n = 96 for all groups). Black bar: control, red bar: RAC 0.1 ppm, green bar: RAC 1 ppm, purple bar: RAC 2 ppm, orange bar: RAC 4 ppm, and blue bar: RAC 8 ppm.
|
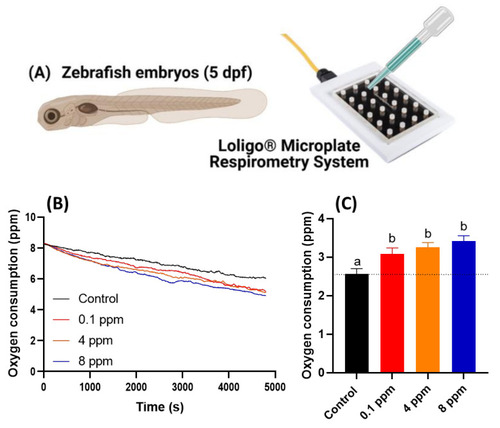
Figure 2. Oxygen consumption of zebrafish larvae at 5 dpf after 24-h incubation in different doses of RAC. (A) Experiment setting used to oxygen consumption measurement by using commercial instrument of Loligo Microplate Respirometry System. (B) The time chronology of dissolved oxygen level measured in the microplate. (C) The relative oxygen consumption for zebrafish embryos treated with different dose of RAC. The data are shown as the means ± SEM and analyzed by Two-way ANOVA either with Kruskal–Wallis One-way ANOVA test with Dunn’s correction as post-hoc multiple comparison test (n = 43–46). Different letters a and b above columns indicate significant statistical differences with p < 0.05. Black bar: control, red bar: RAC 0.1 ppm, orange bar: RAC 4 ppm, and blue bar: RAC 8 ppm.
|
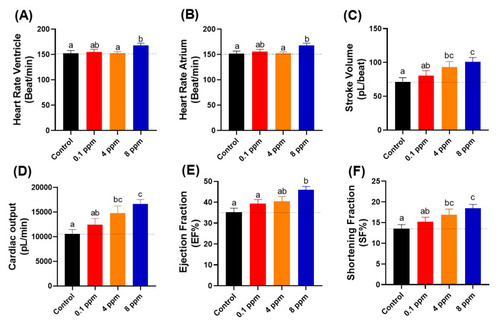
Figure 3. Cardiac physiology analysis of zebrafish larvae at 72 hpf after exposed to different doses of RAC. Several important parameters like (A) heart rate in the ventricle, (B) heart rate in the atrium, (C) stroke volume, (D) cardiac output, (E) ejection fraction and (F) shortening fraction were measured and compared. The data are expressed as the means ± SEM and were analyzed by one-way ANOVA test followed with Fisher’s LSD test. Different letters a, b, and c above columns indicate significant statistical differences with p < 0.05 (n = 27 for all groups). Black bar: control, red bar: RAC 0.1 ppm, orange bar: RAC 4 ppm, and blue bar: RAC 8 ppm.
|
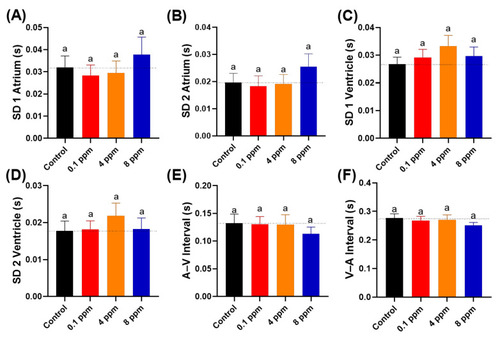
Figure 4. Cardiac rhythm analysis of zebrafish larvae at 72 hpf after 24-h exposure to different doses of RAC. Several important parameters like (A) SD1 of Poincare plot in atrium, (B) SD2 of Poincare plot in atrium, (C) SD1 of Poincare plot in ventricle, (D) SD2 of Poincare plot in ventricle, (E) A–V Interval and (F) V–A Interval were measured and compared. The data are expressed as the means ± SEM and were analyzed by Kruskal–Wallis test followed with Dunn’s multiple comparisons test (n = 27). Same letter ‘a’ above columns indicate no significant statistical differences with p > 0.05. Black bar: control, red bar: RAC 0.1 ppm, orange bar: RAC 4 ppm, and blue bar: RAC 8 ppm.
|
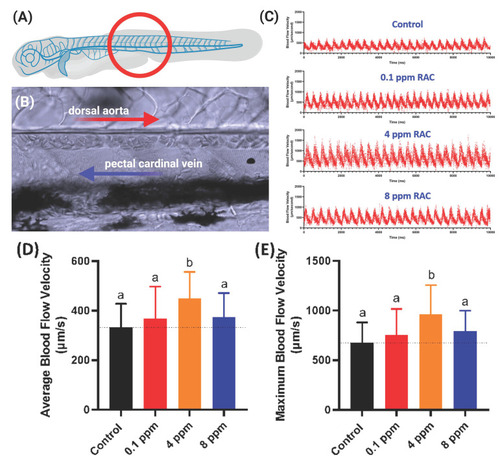
Figure 5. Evaluation of blood flow velocity in zebrafish larvae after exposed to RAC. (A) Schematic diagram showing the position for image capture to calculate blood flow velocity. (B) Magnification of red circle in (A) to show the position of dorsal aorta and post cardinal vein. (C) The time chronology of blood flow rate monitoring in the dorsal aorta of zebrafish embryos. (D) Average and (E) maximal blood flow velocity in the dorsal aorta of zebrafish larvae aged at 72-h post fertilization (hpf) after 24 h incubations in RAC from 48 hpf onwards. The data are shown as the means ± SD and were analyzed by one-way ANOVA test followed with Fisher’s LSD test. Different letters a and b above columns indicate significant statistical differences with p < 0.05 (n = 21 for control, n = 20 for all RAC groups). Black bar: control, red bar: RAC 0.1 ppm, orange bar: RAC 4 ppm, and blue bar: RAC 8 ppm.
|
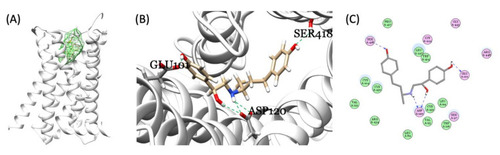
Figure 6. Molecular docking of RAC and zebrafish endogenous β-adrenergic receptor. (A) The identified binding pocket in the middle of the hollow cylinder of the seven transmembrane domain sub-types homology modeling structures of β-adrenergic receptor (adra1aa as an example). Three-dimensional (3D) (B) and 2D (C) illustrations of interactions between RAC and endogenous zebrafish β-adrenergic receptor showing the three hydrogen bond formations between RAC and adra1aa at the positions Glu101, Ser418, and Asp120 (highlighted by the green and blue dotted line).
|
Locomotory activity evaluation after co-incubation of different doses of RAC and PROP in zebrafish larvae after 24-h incubation. Totally, six endpoints of ( |
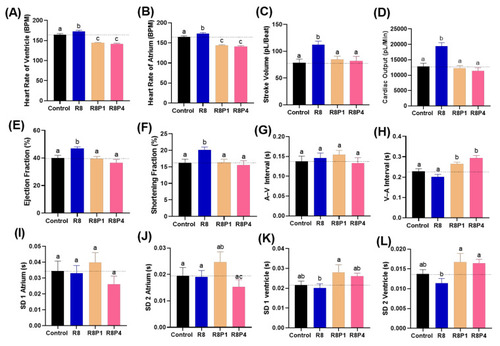
Figure 8. Cardiac physiology alterations of zebrafish larvae at 72 hpf after co-incubation of RAC and PROP at different doses. Several important endpoints like: (A) heart rate in the ventricle, (B) heart rate in the atrium, (C) stroke volume, (D) cardiac output, (E) ejection fraction and (F) shortening fraction (G) A–V interval, (H) V–A interval, (I) SD of Poincare plot in 1 atrium, (J) SD 2 of Poincare plot in atrium, (K) SD 1 of Poincare plot in ventricle, and (L) SD 2 of Poincare plot in ventricle were measured and compared. The data are expressed as the means ± SEM and were analyzed either by one-way ANOVA followed with Fisher’s LSD test or Kruskal–Wallis test with Dunnett’s correction for multiple comparison test. Different letters a, b, and c above columns indicate significant statistical differences with p < 0.05 (n = 20–22). Abbreviations: R8 (RAC 8 ppm), R8P1 (RAC 8 ppm and PROP 1 ppm), and R8P4 (RAC 8 ppm and PROP 4 ppm). Black bar: control, blue bar: R8, cream bar: R8P1, and pink bar: R8P4.
|
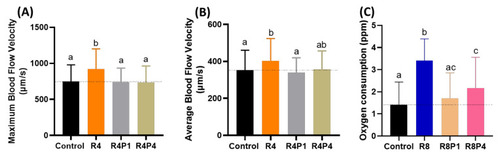
Figure 9. Evaluation of blood flow velocity and oxygen consumption in zebrafish larvae after co-incubating RAC and PROP. (A) Maximal and (B) average blood flow velocity in the dorsal aorta of zebrafish larvae aged at 72-h post fertilization (hpf) after 24 h incubations in RAC–PROP from 48 hpf onwards. The data are shown as the means ± SEM and were analyzed by One-way ANOVA test with Fisher’s LSD test (n Control = 41, n R4 = 40, n R4P1 = 20, and n R4P4 = 20). (C) Oxygen consumption of zebrafish larvae at 5 dpf after 24-h incubation in different doses of RAC and RAC-PROP combination. The data are shown as the means ± SD and analyzed by One-way ANOVA test with Dunn’s correction as post-hoc multiple comparison test (n = 42–46). Different letters a, b, and c above columns indicate significant statistical differences with p < 0.05. Abbreviations: R4 (RAC 4 ppm), R4P1 (RAC 4 ppm, PROP 1 ppm), R4P4 (RAC 4 ppm, PROP 4 ppm), R8 (RAC 8 ppm), R8P1 (RAC 8 ppm, PROP 1 ppm), and R8P4 (RAC 8 ppm, PROP 4 ppm). Black bar: control, orange bar: R4, silver bar: R4P1, gold bar: R4P4, blue bar: R8, cream bar: R8P1, and pink bar: R8P4.
|