
Image
|
Figure Caption
Figure 3
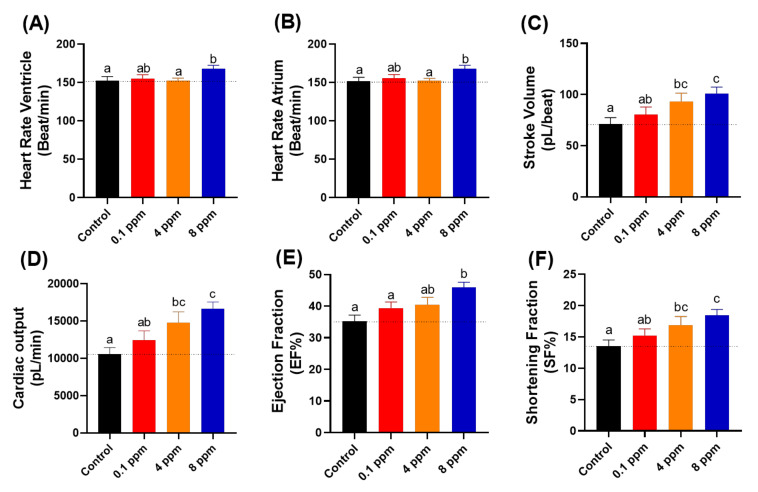
Figure 3. Cardiac physiology analysis of zebrafish larvae at 72 hpf after exposed to different doses of RAC. Several important parameters like (A) heart rate in the ventricle, (B) heart rate in the atrium, (C) stroke volume, (D) cardiac output, (E) ejection fraction and (F) shortening fraction were measured and compared. The data are expressed as the means ± SEM and were analyzed by one-way ANOVA test followed with Fisher’s LSD test. Different letters a, b, and c above columns indicate significant statistical differences with p < 0.05 (n = 27 for all groups). Black bar: control, red bar: RAC 0.1 ppm, orange bar: RAC 4 ppm, and blue bar: RAC 8 ppm.
Acknowledgments
This image is the copyrighted work of the attributed author or publisher, and
ZFIN has permission only to display this image to its users.
Additional permissions should be obtained from the applicable author or publisher of the image.
Full text @ Cells