
FIGURE
Figure 1
- ID
- ZDB-FIG-211002-130
- Publication
- Abbas et al., 2021 - Evaluation of Effects of Ractopamine on Cardiovascular, Respiratory, and Locomotory Physiology in Animal Model Zebrafish Larvae
- Other Figures
- All Figure Page
- Back to All Figure Page
Figure 1
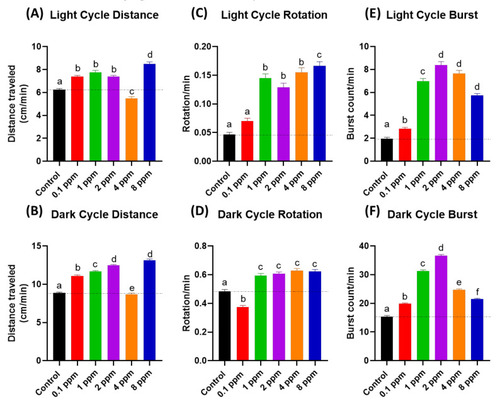
Figure 1. The RAC effect on zebrafish photomotor activities. (A) Total distance traveled of zebrafish larvae after 24-h incubation to different doses of RAC in (A) light cycle and (B) dark cycle. Total rotation movement of zebrafish larvae after 24-h incubation to different doses of RAC in (C) light cycle and (D) dark cycle. Total burst movement of zebrafish larvae after exposed to different doses of RAC for 24 h in (E) light cycle and (F) dark cycle. The data were shown as the Mean ± SEM and analyzed by Kruskal–Wallis test followed with Dunn’s multiple comparisons test. Different letters a, b, c, d, e, and f above columns indicate significant statistical differences with p < 0.05 (n = 96 for all groups). Black bar: control, red bar: RAC 0.1 ppm, green bar: RAC 1 ppm, purple bar: RAC 2 ppm, orange bar: RAC 4 ppm, and blue bar: RAC 8 ppm.
|
Expression Data
Expression Detail
Antibody Labeling
Phenotype Data
Phenotype Detail
Acknowledgments
This image is the copyrighted work of the attributed author or publisher, and
ZFIN has permission only to display this image to its users.
Additional permissions should be obtained from the applicable author or publisher of the image.
Full text @ Cells