
FIGURE
Figure 9
- ID
- ZDB-FIG-211002-134
- Publication
- Abbas et al., 2021 - Evaluation of Effects of Ractopamine on Cardiovascular, Respiratory, and Locomotory Physiology in Animal Model Zebrafish Larvae
- Other Figures
- All Figure Page
- Back to All Figure Page
Figure 9
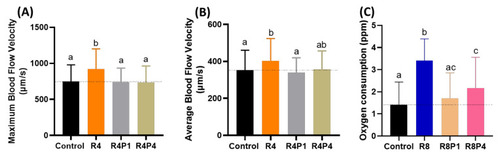
Figure 9. Evaluation of blood flow velocity and oxygen consumption in zebrafish larvae after co-incubating RAC and PROP. (A) Maximal and (B) average blood flow velocity in the dorsal aorta of zebrafish larvae aged at 72-h post fertilization (hpf) after 24 h incubations in RAC–PROP from 48 hpf onwards. The data are shown as the means ± SEM and were analyzed by One-way ANOVA test with Fisher’s LSD test (n Control = 41, n R4 = 40, n R4P1 = 20, and n R4P4 = 20). (C) Oxygen consumption of zebrafish larvae at 5 dpf after 24-h incubation in different doses of RAC and RAC-PROP combination. The data are shown as the means ± SD and analyzed by One-way ANOVA test with Dunn’s correction as post-hoc multiple comparison test (n = 42–46). Different letters a, b, and c above columns indicate significant statistical differences with p < 0.05. Abbreviations: R4 (RAC 4 ppm), R4P1 (RAC 4 ppm, PROP 1 ppm), R4P4 (RAC 4 ppm, PROP 4 ppm), R8 (RAC 8 ppm), R8P1 (RAC 8 ppm, PROP 1 ppm), and R8P4 (RAC 8 ppm, PROP 4 ppm). Black bar: control, orange bar: R4, silver bar: R4P1, gold bar: R4P4, blue bar: R8, cream bar: R8P1, and pink bar: R8P4.
|
Expression Data
Expression Detail
Antibody Labeling
Phenotype Data
Phenotype Detail
Acknowledgments
This image is the copyrighted work of the attributed author or publisher, and
ZFIN has permission only to display this image to its users.
Additional permissions should be obtained from the applicable author or publisher of the image.
Full text @ Cells