
FIGURE
Figure 4
- ID
- ZDB-FIG-211002-133
- Publication
- Abbas et al., 2021 - Evaluation of Effects of Ractopamine on Cardiovascular, Respiratory, and Locomotory Physiology in Animal Model Zebrafish Larvae
- Other Figures
- All Figure Page
- Back to All Figure Page
Figure 4
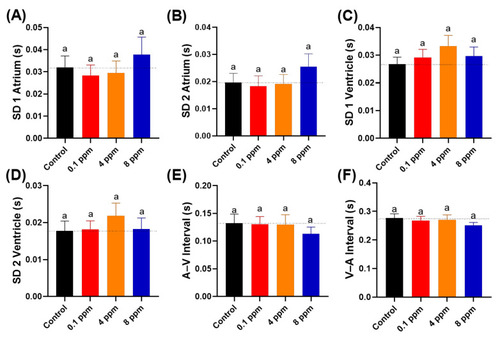
Figure 4. Cardiac rhythm analysis of zebrafish larvae at 72 hpf after 24-h exposure to different doses of RAC. Several important parameters like (A) SD1 of Poincare plot in atrium, (B) SD2 of Poincare plot in atrium, (C) SD1 of Poincare plot in ventricle, (D) SD2 of Poincare plot in ventricle, (E) A–V Interval and (F) V–A Interval were measured and compared. The data are expressed as the means ± SEM and were analyzed by Kruskal–Wallis test followed with Dunn’s multiple comparisons test (n = 27). Same letter ‘a’ above columns indicate no significant statistical differences with p > 0.05. Black bar: control, red bar: RAC 0.1 ppm, orange bar: RAC 4 ppm, and blue bar: RAC 8 ppm.
|
Expression Data
Expression Detail
Antibody Labeling
Phenotype Data
Phenotype Detail
Acknowledgments
This image is the copyrighted work of the attributed author or publisher, and
ZFIN has permission only to display this image to its users.
Additional permissions should be obtained from the applicable author or publisher of the image.
Full text @ Cells