IMAGE

Figure 7

ID
ZDB-IMAGE-211002-112
Source
Figures for Abbas et al., 2021
Image
Figure Caption

Figure 7

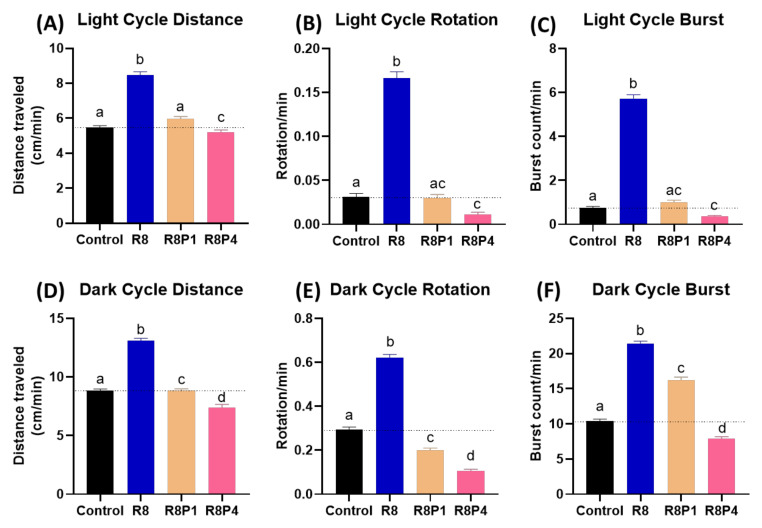
Locomotory activity evaluation after co-incubation of different doses of RAC and PROP in zebrafish larvae after 24-h incubation. Totally, six endpoints of (A) Light cycle distance, (B) Dark cycle distance, (C) Light cycle rotation, (D) Dark cycle rotation, (E) Light cycle burst, and (F) Dark cycle burst were measured and compared. The statistics were demonstrated as the mean ± SEM and analyzed by Kruskal–Wallis test followed with Dunn’s multiple comparisons test. Different letters a, b, c, and d above columns indicate significant statistical differences with p < 0.05 (n = 48). Abbreviations: R8 (RAC 8 ppm), R8P1 (RAC 8 ppm and PROP 1 ppm), and R8P4 (RAC 8 ppm and PROP 4 ppm). Black bar: control, blue bar: R8, cream bar: R8P1, and pink bar: R8P4.

Acknowledgments
This image is the copyrighted work of the attributed author or publisher, and ZFIN has permission only to display this image to its users. Additional permissions should be obtained from the applicable author or publisher of the image. Full text @ Cells