
FIGURE
Figure 8
- ID
- ZDB-FIG-211002-44
- Publication
- Abbas et al., 2021 - Evaluation of Effects of Ractopamine on Cardiovascular, Respiratory, and Locomotory Physiology in Animal Model Zebrafish Larvae
- Other Figures
- All Figure Page
- Back to All Figure Page
Figure 8
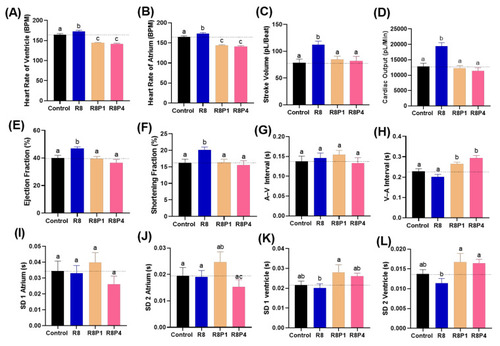
Figure 8. Cardiac physiology alterations of zebrafish larvae at 72 hpf after co-incubation of RAC and PROP at different doses. Several important endpoints like: (A) heart rate in the ventricle, (B) heart rate in the atrium, (C) stroke volume, (D) cardiac output, (E) ejection fraction and (F) shortening fraction (G) A–V interval, (H) V–A interval, (I) SD of Poincare plot in 1 atrium, (J) SD 2 of Poincare plot in atrium, (K) SD 1 of Poincare plot in ventricle, and (L) SD 2 of Poincare plot in ventricle were measured and compared. The data are expressed as the means ± SEM and were analyzed either by one-way ANOVA followed with Fisher’s LSD test or Kruskal–Wallis test with Dunnett’s correction for multiple comparison test. Different letters a, b, and c above columns indicate significant statistical differences with p < 0.05 (n = 20–22). Abbreviations: R8 (RAC 8 ppm), R8P1 (RAC 8 ppm and PROP 1 ppm), and R8P4 (RAC 8 ppm and PROP 4 ppm). Black bar: control, blue bar: R8, cream bar: R8P1, and pink bar: R8P4.
|
Expression Data
Expression Detail
Antibody Labeling
Phenotype Data
Phenotype Detail
Acknowledgments
This image is the copyrighted work of the attributed author or publisher, and
ZFIN has permission only to display this image to its users.
Additional permissions should be obtained from the applicable author or publisher of the image.
Full text @ Cells