
Image
|
Figure Caption
Figure 2
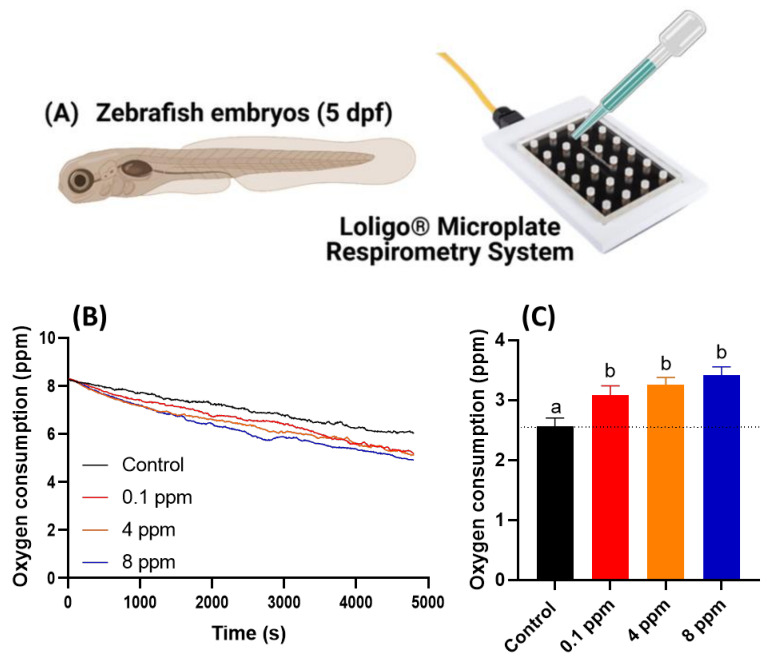
Figure 2. Oxygen consumption of zebrafish larvae at 5 dpf after 24-h incubation in different doses of RAC. (A) Experiment setting used to oxygen consumption measurement by using commercial instrument of Loligo Microplate Respirometry System. (B) The time chronology of dissolved oxygen level measured in the microplate. (C) The relative oxygen consumption for zebrafish embryos treated with different dose of RAC. The data are shown as the means ± SEM and analyzed by Two-way ANOVA either with Kruskal–Wallis One-way ANOVA test with Dunn’s correction as post-hoc multiple comparison test (n = 43–46). Different letters a and b above columns indicate significant statistical differences with p < 0.05. Black bar: control, red bar: RAC 0.1 ppm, orange bar: RAC 4 ppm, and blue bar: RAC 8 ppm.
Acknowledgments
This image is the copyrighted work of the attributed author or publisher, and
ZFIN has permission only to display this image to its users.
Additional permissions should be obtained from the applicable author or publisher of the image.
Full text @ Cells