
Image
|
Figure Caption
Figure 5
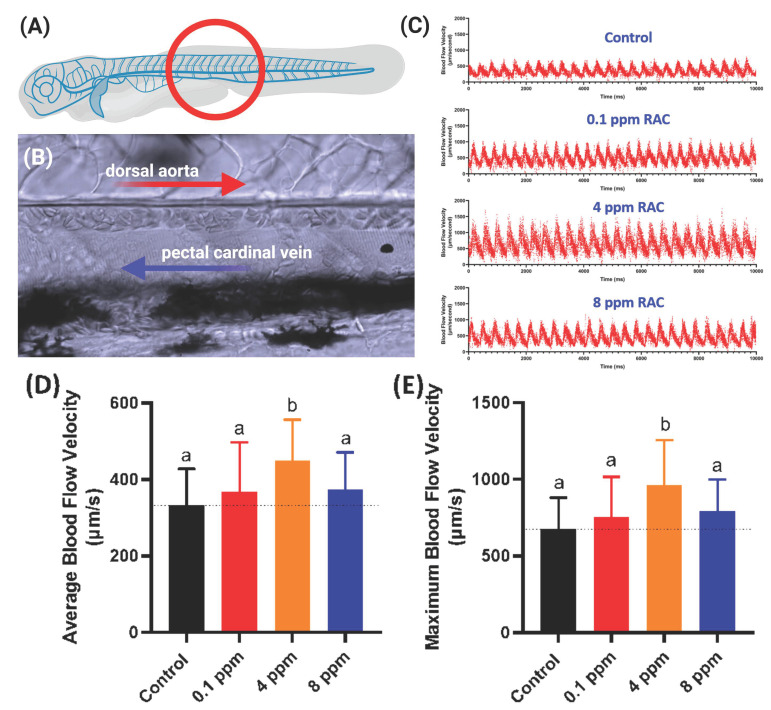
Figure 5. Evaluation of blood flow velocity in zebrafish larvae after exposed to RAC. (A) Schematic diagram showing the position for image capture to calculate blood flow velocity. (B) Magnification of red circle in (A) to show the position of dorsal aorta and post cardinal vein. (C) The time chronology of blood flow rate monitoring in the dorsal aorta of zebrafish embryos. (D) Average and (E) maximal blood flow velocity in the dorsal aorta of zebrafish larvae aged at 72-h post fertilization (hpf) after 24 h incubations in RAC from 48 hpf onwards. The data are shown as the means ± SD and were analyzed by one-way ANOVA test followed with Fisher’s LSD test. Different letters a and b above columns indicate significant statistical differences with p < 0.05 (n = 21 for control, n = 20 for all RAC groups). Black bar: control, red bar: RAC 0.1 ppm, orange bar: RAC 4 ppm, and blue bar: RAC 8 ppm.
Acknowledgments
This image is the copyrighted work of the attributed author or publisher, and
ZFIN has permission only to display this image to its users.
Additional permissions should be obtained from the applicable author or publisher of the image.
Full text @ Cells