
- Title
-
Fli1+ cells transcriptional analysis reveals an Lmo2-Prdm16 axis in angiogenesis
- Authors
- Matrone, G., Xia, B., Chen, K., Denvir, M.A., Baker, A.H., Cooke, J.P.
- Source
- Full text @ Proc. Natl. Acad. Sci. USA
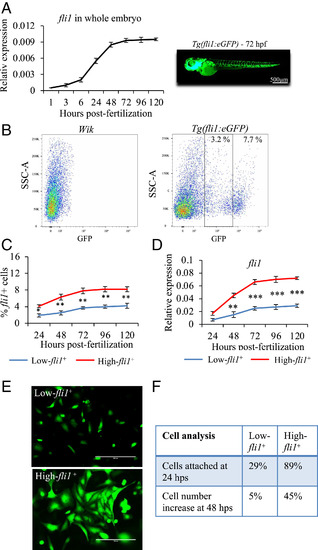
Characterization of low- and high-fli1+ cells. (A) qPCR analysis of fli1 gene expression during zebrafish development (from 1 to 120 hpf). (B) Following enzymatic disaggregation of Tg(fli1:EGFP)y1 zebrafish embryos at 72 hpf, two populations of low- and high-fli1+ cells were identified. Wik zebrafish were used to set the gate for fli1− cells. (C and D) Line graphs showing the percentage of low- and high-fli1+ cells at different developmental stages (C) and relative fli1 gene expression (D). (E) Fluorescent images of low- and high-fli1+ cells 24 h after seeded on fibronectin-coated dishes with endothelial growth medium. (F) Table of cell characterization (percent attached cells and cell number increase). n = 3 experiments; ANOVA test followed by Bonferroni post hoc was used to compare means. ***P ≤ 0.001, **P ≤ 0.01, *P ≤ 0.05. |
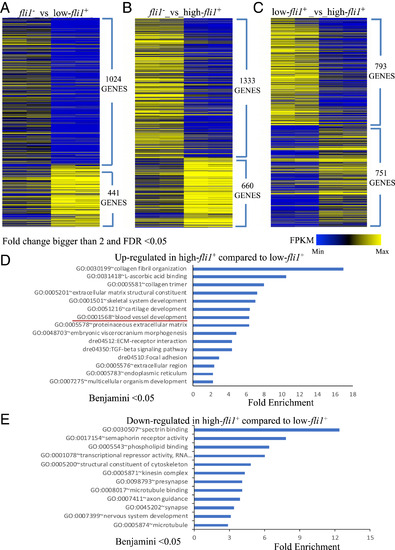
Bioinformatic analysis. (A–C) Heat maps displaying the expression level of genes up- or down-regulated in the negative-, low-, and high-fli1+ cells, with each of the two populations compared separately. Genes for which the fold change was bigger than two and FDR was less than 0.05 were included in the heat maps. (D and E) Bar plots showing enrichment Q- values of functional terms in genes up-regulated (D) or down-regulated (E) in high-fli1+ compared with low-fli1+. Up-regulated or down-regulated genes were defined based on EdgeR FDR cutoff 1e-5. PHENOTYPE:
|
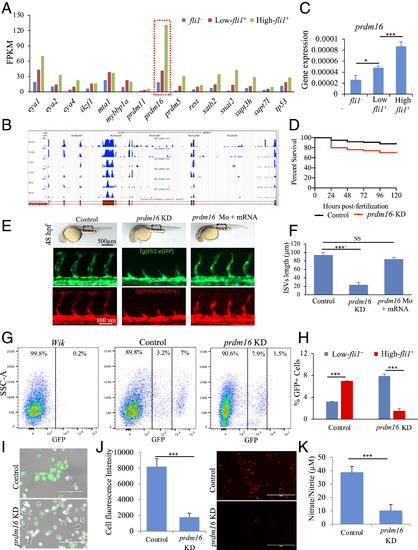
Assessment of prdm16 function in Tg(fli1:EGFP)y1 zebrafish. (A) Prdm16 was selected from a list of epigenetic modifiers. (B) RNA-Seq read mapping of prdm16 for all three groups of fli1−, low-, and high-fli1+, in duplicate. (C) qPCR analysis confirmed RNA-Seq data showing the higher expression of prdm16 in fli1+ cells. (D) Kaplan-Meyer survival curve of zebrafish embryos following prdm16-targeted Mo injection and control (mismatch). (E) Brightfield images (Upper) of whole embryos showing the gross phenotype following injection of prdm16 Mo. Fluorescent images of the trunk regions in Tg(fli1:EGFP) (Middle) and Tg(kdrl:mCherry) (Lower) embryos, showing changes in the ISVs following prdm16 KD. These effects were rescued when the prdm16 Mo was coinjected with prdm16 mRNA. (F) The average lengths of the ISVs. (G and H) FACS graph and data analysis showing changes in the percentage of low- and high-fli1+ population following prdm16 KD. (I–K) Analysis of total fli1+ cells isolated from prdm16 KD and control embryos and cultured on fibronectin-coated dishes. Merged brightfield and fluorescent images (I), fluorescence images showing the uptake of acetylated low-density lipoprotein (J), and nitrate/nitrite assay as measure of nitric oxide (K). n = 3 experiments; ANOVA test followed by Bonferroni post hoc was used to compared means. NS, not significant. ***P ≤ 0.001, *P ≤ 0.05. EXPRESSION / LABELING:
PHENOTYPE:
|
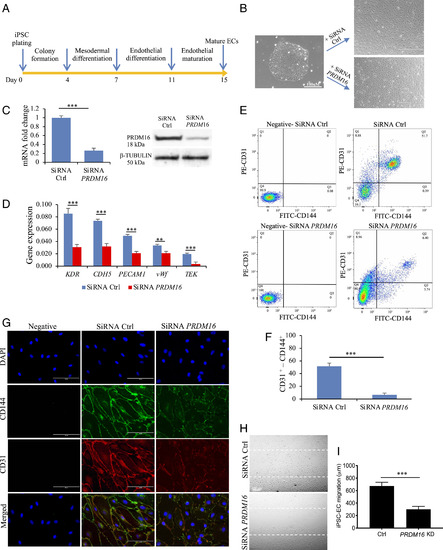
Assessment of PRDM16 function in iPSC-EC. (A) Differentiation protocol for the generation of iPSC-derived ECs (see details in Methods). At day 7, cells were incubated with siRNA control (Ctrl) or targeting PRDM16. (B) Brightfield images of an iPSC colony and of the iPSC-derived ECs, showing a different phenotype following treatment with SiRNA for PRDM16. (C) qPCR bar graph and Western blot showing the reduced expression of PRDM16 mRNA and protein in cells following PRDM16 siRNA treatment. (D) qPCR data showing the reduced expression of endothelial markers in iPSC-derived EC following PRDM16 KD. (E) FACS analysis for the endothelial markers CD31 and CD144 in iPSC-EC showing a significantly reduced population of CD31+-CD144+ in PRDM16 KD cells compared with controls, as shown in the bar graph in F. In negative samples, no first antibodies were added. (G) Immunofluorescence staining for endothelial markers CD31 and CD144 (vascular endothelial (VE)-Cadherin). iPSC-EC with no first antibodies added were used as negative control. (H) Migration assay in iPSC-EC showed that PRDM16 KD reduces cell migration, as shown by a larger residual gap between the edges of the wounded monolayer, quantified in I. n = 3 experiments; Student’s t test, ***P ≤ 0.001, **P ≤ 0.01, compared with controls. |
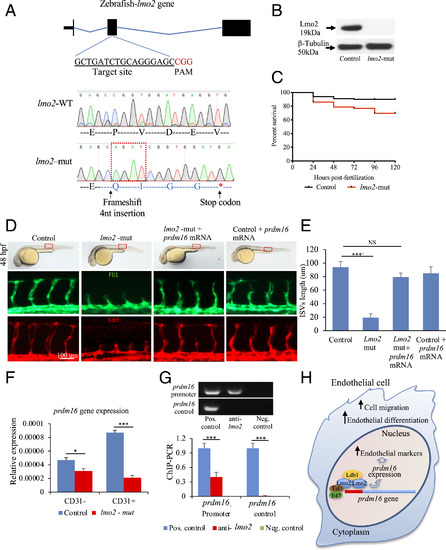
Lmo2 impacts zebrafish angiogenesis by regulating prdm16. (A) lmo2-mut in zebrafish by CRISPR/Cas9. gRNAs produced a 4-nucleotide insertion in the exon 2 and a stop codon downstream. (B) Western blot using an anti-Lmo2 antibody confirmed the absence of Lmo2. β-Tubulin was used as loading control. (C) Kaplan-Meyer survival curve of lmo2-mut zebrafish. (D) Brightfield images (Upper) showing the lmo2-mut embryo gross phenotype. Fluorescent images of the trunk region following immunostaining for Fli1 (Middle) and Kdrl (Lower), showing the reduced average length of ISVs in lmo2-mut and the rescue of vascular defects when prdm16 mRNA was injected. These data are graphically shown in E. (F) qPCR analysis showing the expression of PRDM16 in CD31+ and CD31− cell isolated from lmo2-mut embryos. (G) ChIP–PCR showing the association of Lmo2 to the prdm16 gene; gel electrophoresis of PCR products. The prdm16 promoter region, but not a control region ∼1-kb downstream, was precipitated by the anti-Lmo2 antibody. Sheared chromatin before immunoprecipitation and immunoprecipitation using spermine served as positive and negative controls, respectively. (H) Graphical abstract showing the relationship between Lmo2–prdm16 and the role of prdm16 on angiogenesis. n = 3 experiments; ANOVA test followed by Bonferroni post hoc was used to compare means. NS, not significant. ***P ≤ 0.001, *P ≤ 0.05. |