
FIGURE
Fig. 2
- ID
- ZDB-FIG-220429-18
- Publication
- Matrone et al., 2021 - Fli1+ cells transcriptional analysis reveals an Lmo2-Prdm16 axis in angiogenesis
- Other Figures
- All Figure Page
- Back to All Figure Page
Fig. 2
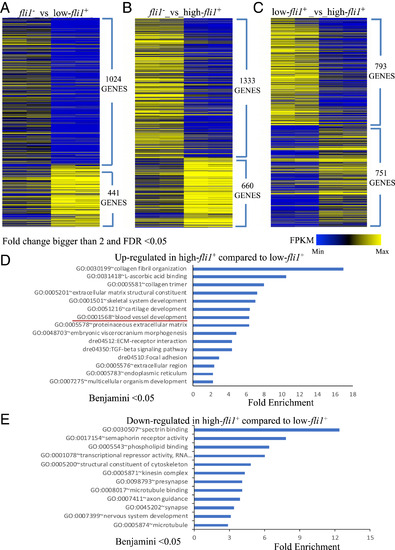
Bioinformatic analysis. (A–C) Heat maps displaying the expression level of genes up- or down-regulated in the negative-, low-, and high-fli1+ cells, with each of the two populations compared separately. Genes for which the fold change was bigger than two and FDR was less than 0.05 were included in the heat maps. (D and E) Bar plots showing enrichment Q- values of functional terms in genes up-regulated (D) or down-regulated (E) in high-fli1+ compared with low-fli1+. Up-regulated or down-regulated genes were defined based on EdgeR FDR cutoff 1e-5. |
Expression Data
Expression Detail
Antibody Labeling
Phenotype Data
| Fish: | |
|---|---|
| Observed In: | |
| Stage: | Protruding-mouth |
Phenotype Detail
Acknowledgments
This image is the copyrighted work of the attributed author or publisher, and
ZFIN has permission only to display this image to its users.
Additional permissions should be obtained from the applicable author or publisher of the image.
Full text @ Proc. Natl. Acad. Sci. USA