
Fig. 3
|
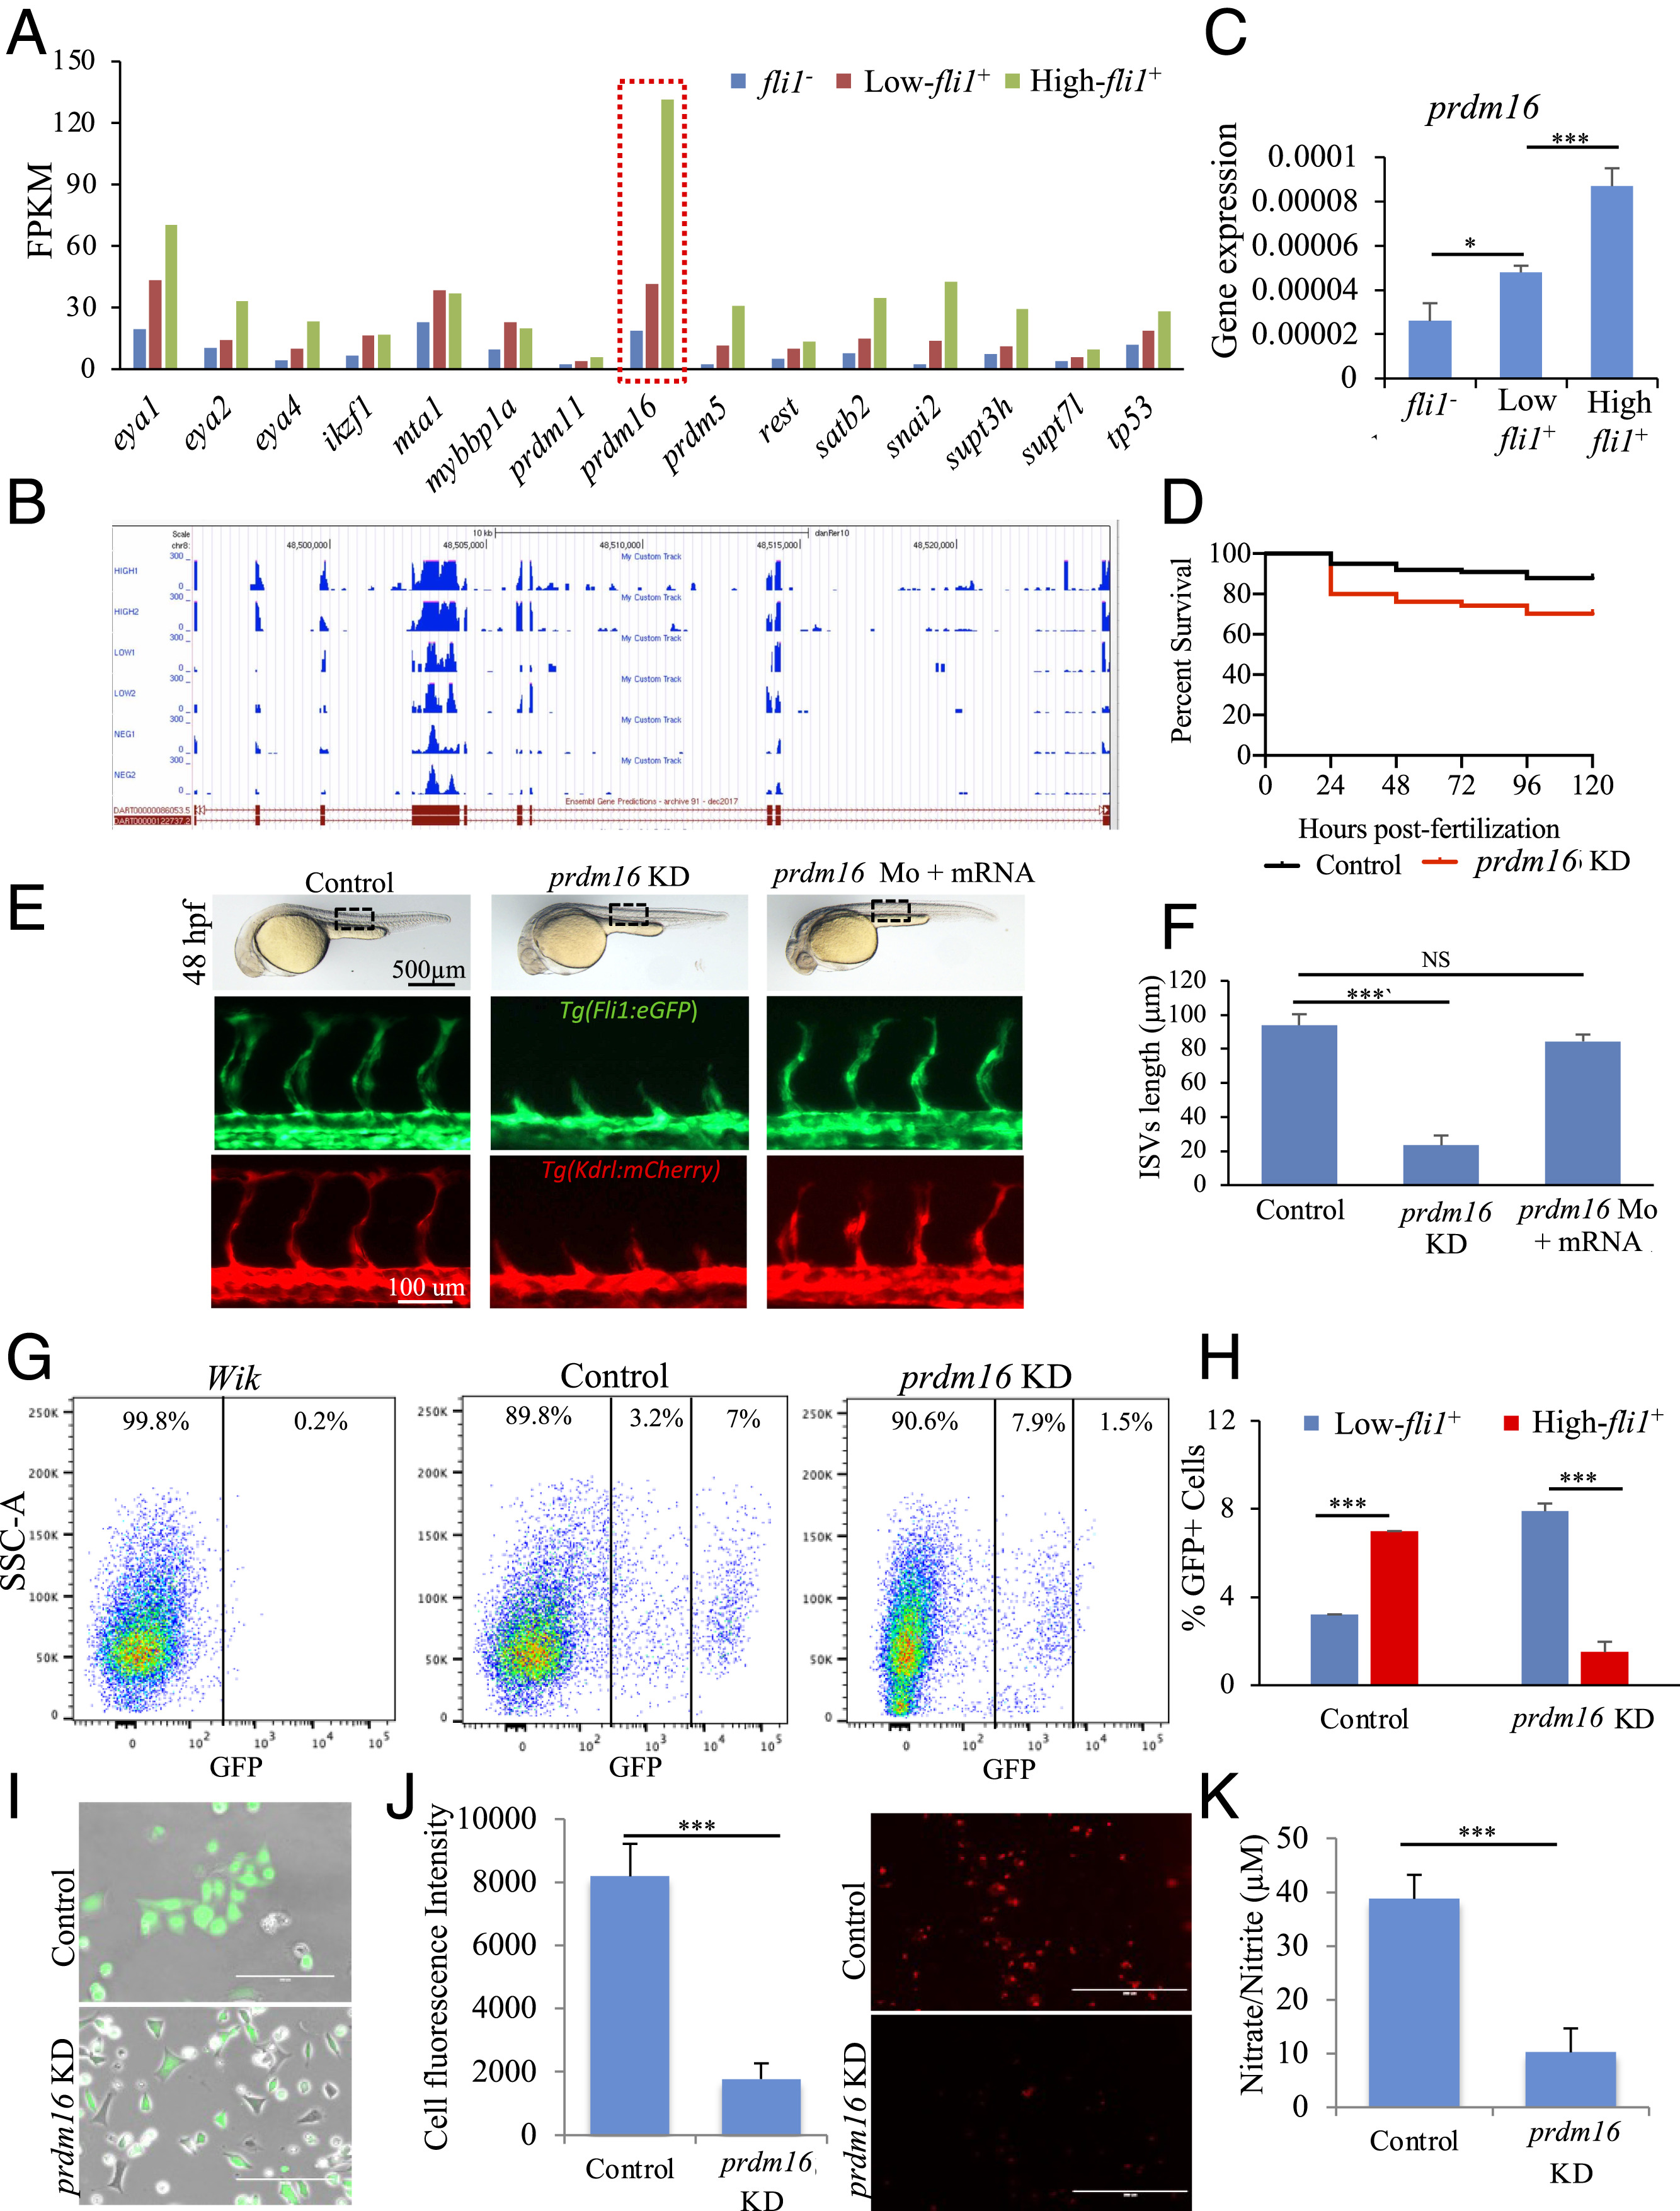
Fig. 3 Assessment of prdm16 function in Tg(fli1:EGFP)y1 zebrafish. (A) Prdm16 was selected from a list of epigenetic modifiers. (B) RNA-Seq read mapping of prdm16 for all three groups of fli1−, low-, and high-fli1+, in duplicate. (C) qPCR analysis confirmed RNA-Seq data showing the higher expression of prdm16 in fli1+ cells. (D) Kaplan-Meyer survival curve of zebrafish embryos following prdm16-targeted Mo injection and control (mismatch). (E) Brightfield images (Upper) of whole embryos showing the gross phenotype following injection of prdm16 Mo. Fluorescent images of the trunk regions in Tg(fli1:EGFP) (Middle) and Tg(kdrl:mCherry) (Lower) embryos, showing changes in the ISVs following prdm16 KD. These effects were rescued when the prdm16 Mo was coinjected with prdm16 mRNA. (F) The average lengths of the ISVs. (G and H) FACS graph and data analysis showing changes in the percentage of low- and high-fli1+ population following prdm16 KD. (I–K) Analysis of total fli1+ cells isolated from prdm16 KD and control embryos and cultured on fibronectin-coated dishes. Merged brightfield and fluorescent images (I), fluorescence images showing the uptake of acetylated low-density lipoprotein (J), and nitrate/nitrite assay as measure of nitric oxide (K). n = 3 experiments; ANOVA test followed by Bonferroni post hoc was used to compared means. NS, not significant. ***P ≤ 0.001, *P ≤ 0.05.