
- Title
-
The Lysine Methylase SMYD3 Modulates Mesendodermal Commitment during Development
- Authors
- Fittipaldi, R., Floris, P., Proserpio, V., Cotelli, F., Beltrame, M., Caretti, G.
- Source
- Full text @ Cells
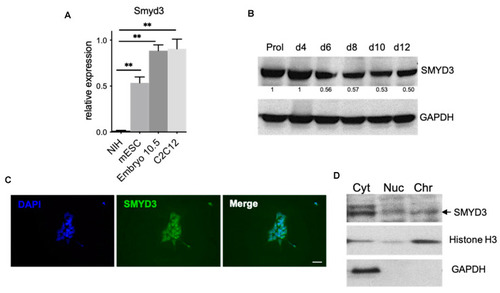
SMYD3 is expressed in mouse embryo and in mouse embryonic stem cells (mESCs). (A) mRNA was extracted from NIH3T3, C2C12 myoblasts and mESC in parallel with d10.5 embryo and Smyd3 transcript levels were measured by qRT-PCR. Data were normalized to GAPDH. Means from three independent experiments are shown. ** p < 0.01 value for the significance is shown in the plot. (B) Immunoblot analysis of SMYD3 protein levels at different time points of ESC differentiation. GAPDH served as a loading control. Normalized band intensity in immunoblots is reported below signals. Representative image of three independent experiments. (C) Immunofluorescence was performed on undifferentiated mESCs with an antibody raised against SMYD3. Nuclei were visualized by DAPI staining (blue). Scale bar: 50 μm. (D) ESCs were analyzed by biochemical fractionation, followed by immunoblot, to characterize SMYD3 distribution in different fractions: cytoplasmic or soluble fraction (Cyt), solubilized nuclear proteins fraction (Nuc), and chromatin-nuclear matrix-bound fraction (Chr). GAPDH served as Cyt control, while H3 served as Chr control. Representative image of two independent experiments. EXPRESSION / LABELING:
PHENOTYPE:
|

SMYD3 depletion does not interfere with stemness. (A) mRNA was extracted at different stages of ESC differentiation, and Smyd3 or pluripotency-related gene (Nanog, Klf4, Pou5f1/Oct4) transcript levels were evaluated throughout differentiation by qRT-PCR. Means and SEM from three independent experiments are shown. (B) Nanog, Oct4 and SMYD3 protein levels were analyzed by immunoblot. Data were normalized to GAPDH. Normalized band intensity in immunoblots is reported below signals. Representative image of three independent experiments. |

SMYD3 knockdown increases mesendodermal marker expression in differentiating mESCs. (A,B) mRNA levels of mesendodermal markers (Eomes, Mesp1, Sox17, Foxa2, T/Brachyury) were measured by qRT-PCR. Data were normalized to Gapdh. Means and SEM from three independent experiments are shown. Significance was calculated by 2-way Anova, followed by Bonferroni post hoc test. * p < 0.05, *** p < 0.001 value for the significance is shown in the plot. (C) eGFP reporter fluorescence was analyzed in EBs infected with Sh-Scramble/Brachyury-eGFP and Sh-SMYD3/Brachyury-eGFP at day 6 of differentiation. Scale bar: 20 μm. (D) Primitive ectoderm genes (Otx2, Fgf5, Sox1) expression was measured by qRT-PCR at different time points. Means and SEM from three independent experiments are shown. |
EXPRESSION / LABELING:
PHENOTYPE:
|

SMYD3 depletion enhances early cardiac differentiation in mESCs. (A) Gene expression of early cardiac markers Isl1 and Nkx2-5 was analyzed by qRT-PCR. Data were normalized to Gapdh. Means and SEM from three independent experiments are shown. Significance was calculated by 2-way Anova, followed by Bonferroni post hoc test. ** p < 0.01, *** p < 0.001 value for the significance is shown in the plot. (B) Western blot analysis was performed on mESCs protein extracts at different time of differentiation, with antibodies raised against Flk1. GAPDH serves as a loading control. Normalized band intensity in immunoblots is reported below signals. (C) Immunofluorescence analysis was performed with Flk1 antibodies at d5 of EB differentiation. DAPI stains nuclei. Scale bar: 200 μm. |

SMYD3 modulates late cardiovascular markers. (A) Cardiac markers, TnnT2, Myh7 and Myl7, were measured by qRT-PCR at d0, d6, d8, d10 and d12 of mESCs differentiation. Data were normalized to GAPDH. One representative experiment is shown; n = 2. (B) Beating EBs were counted at d10, d11, d12 of EBs formation in Sh-Scramble and Sh-SMYD3. Significance was calculated by 2-way Anova, followed by Bonferroni post hoc test. * p < 0.05 value for the significance is shown in the plot. n = 3. (C) αSMA mRNA levels were measured by qRT-PCR as in (A). One representative experiment is shown: n = 2. (D) Western blot analysis of αSMA protein extracts of Sh-Scramble and Sh-SMYD3 EBs at d10, d12, d14. GAPDH serves as a loading control. Normalized band intensity in immunoblots is reported below signals. (E) Immunofluorescence microscopy was performed on d10 EBs with antibodies against the endothelial marker CD31. DAPI stains nuclei. Scale bar: 100 μm. (F) kdrl expression was analyzed at 48 hpf, in standard control and smyd3 morphants. Lines show posterior cardinal vein, dorsal aorta, inter-segmental vessels and caudal vein (PCV, DA, ISVs, CV, respectively). |