FIGURE SUMMARY
Title

Studies in Zebrafish Demonstrate That CNNM2 and NT5C2 Are Most Likely the Causal Genes at the Blood Pressure-Associated Locus on Human Chromosome 10q24.32

Authors
Vishnolia, K.K., Hoene, C., Tarhbalouti, K., Revenstorff, J., Aherrahrou, Z., Erdmann, J.
Source
Full text @ Front Cardiovasc Med

(A) Regional association plot for human locus 10q24.32 on chromosome 10 showing genome wide significant single nucleotide polymorphisms for blood pressure phenotype. Figure adapted from (17). (B) First part of 10q24.32 locus conserved in zebrafish genome at chromosome 13 encompassing “a” paralogs of cnnm2, nt5c2, and cyp17a1 with borcs7. (C) Second part of 10q24.32 locus region conserved in zebrafish genome at chromosome 1 encompassing “b” paralogs of cnnm2 and nt5c2, along with as3mt genes.

Screen shot images of MicroZebraLab software while recording a video file for analyzing blood flow parameters from zebrafish. (A) Red box represents the area of dorsal aorta selected manually for preparing the video, (B) gray scale image from the software showing measurement of vessel diameter from where the blood flow parameters are measured.

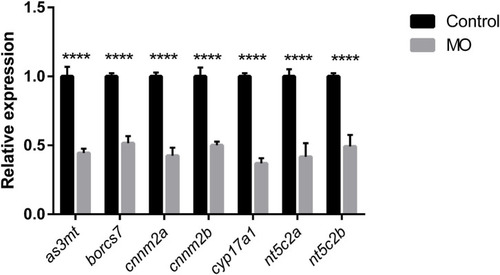
Graph represents downregulation of the relative gene expression of as3mt, borcs7, cnnm2a, cnnm2b, cyp17a1, nt5c2a, and nt5c2b measured at 72 h post morpholino injections compare to their respective controls injected with control morpholinos from n = 10 larvae per group. Error bars represents standard deviation and significance was set at p < 0.05. **** represent the significant differences among the samples.

Graphs represents blood flow parameters measured after downregulation of as3mt, borcs7, cnnm2a, cnnm2b, cyp17a1, nt5c2a, and nt5c2b genes in zebrafish using transcriptional splice modification morpholinos. Blood flow (nL/sec), arterial pulse (beats per minute) and linear velocity (μM/sec) compared against their respective control groups. Data was generated from n = 9 larvae per groups, error bars represents standard deviation and significance was set at p < 0.05.

Blood flow parameters measured from heterozygote and homozygote cnnm2a, nt5c2a, and cyp17a1 zebrafish mutants and compared against ab-wildtypes as control. Blood flow (nL/sec), arterial pulse (beats per minute) and linear velocity (μM/sec) were measured from n = 6 larvae per group and presented here as mean ± standard deviation and significance was set at p < 0.05.

Blood flow parameters measured with and without Ramipril treatments from cnnm2a and nt5c2a mutant zebrafish larvae along with ab-wildtypes as control. Blood flow (nL/sec), arterial pulse (beats per minute), vessel diameter (μm) and linear velocity (μM/sec) were measured from n = 6 larvae per group and presented here as mean with standard deviation as error bars and significance was set at p < 0.05.

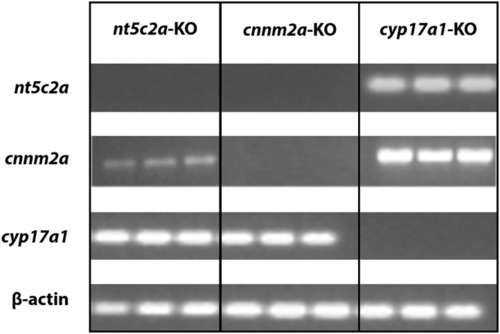
Co-regulation of cnnm2 and nt5c2 genes. Agarose gel micrograph representing bands of DNA samples collected from cnnm2a, cyp17a1, and nt5c2a mutants. Each set of samples were investigated for expression of other genes along with house-keeping genes.

Microscopic images of May-Grünwald-Giemsa–stained blood smear from ab-wildtype and nt5c2a mutant (heterozygote and homozygote) zebrafish larvae (n = 6 per group). Black arrows on the stained image from nt5c2a mutant represents the groups of immature blood cells without any cytoplasmic material. Images were captured at 40X magnification. Red and black arrows on the stained image from nt5c2a mutants represents the group of multi-nucleated and immature blood cells without any cytoplasmic material respectively.

Graph on the left presents the renin levels (ng/ml) measured using ELISA assay from ab-wildtypes, nt5c2a and cnnm2a zebrafish mutant larvae. Assay was performed with six groups per genotype with n = 10 larvae per group (n = 60 larvae per genotype). Graph on the right presents relative expression of ren gene in ab-wild type, nt5c2a and cnnm2a mutant zebrafish larvae (n = 6 larvae per group). Data is presented as mean of the biological replicates with standard deviation in error bars. Significance was set at p < 0.05.

EXPRESSION / LABELING:
Gene:
Fish:
Anatomical Term:
Stage: Day 4
PHENOTYPE:
Fish:
Observed In:
Stage: Day 4

Zebrafish cnnm2a mutant (heterozygote and homozygote) larvae along with wildtype controls micro injected with rhodamine dextran dye in their pericardial sac. Bright field and fluorescent images captured at 3, 12, and 24 h post injection represent the inefficiency of cnnm2a mutant larvae to filter the dextran dye through kidney as the controls. Images were captured using Keyence inverted microscope at 40X magnification.

ZFIN is incorporating published figure images and captions as part of an ongoing project. Figures from some publications have not yet been curated, or are not available for display because of copyright restrictions.

Acknowledgments
This image is the copyrighted work of the attributed author or publisher, and ZFIN has permission only to display this image to its users. Additional permissions should be obtained from the applicable author or publisher of the image. Full text @ Front Cardiovasc Med