Effects of high-cholesterol diet (HCD) and berberine (BBR) treatment on the growth of zebrafish. (A) Description of the experimental design. (B) Body length, (C) average body weight, and (D) BMI in each group were measured at 15 days post-fertilization (dpf). (E) Larvae with different treatments were scored for mortality. (F) The hepatic steatosis of zebrafish was detected by whole-body Oil Red O (ORO) staining. (G) Percent of larvae with hepatic steatosis. *Compared with the control; #compared with the HCD group, P < 0.05. Bar, 1 mm.

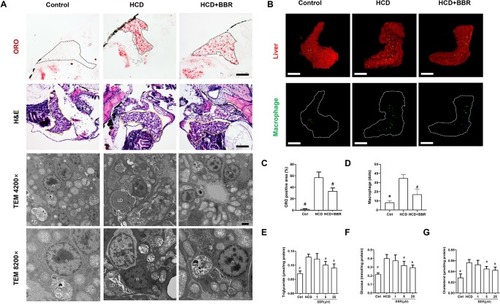
Effects of berberine (BBR) on hepatic steatosis in high-cholesterol diet (HCD)-induced zebrafish larvae. (A) The zebrafish larvae were treated with the control diet, HCD diet, and HCD plus BBR (5 μM) treatment. Hepatic steatosis was observed by whole-body Oil Red O (ORO) staining (line 1, refer to the black dotted, bar = 100 μm), H&E staining (line 2, refer to the yellow dotted, bar = 100 μm), and TEM (line 3, bar = 2μm; line 4, bar = 1 μm). m mitochondrion, n cell nucleus, LD lipid droplet. (B) L-plastin-labeled macrophages in Tg (fabp10a: dsRed) zebrafish. The statistical results of the positive area of ORO staining were shown in (C) and the quantity of macrophage in the liver of larval zebrafish in (D). Effects of BBR on the levels of triglyceride (E), glucose (F), and cholesterol (G) in livers of zebrafish larvae fed with HCD. #Compared with the HCD group, P < 0.05.

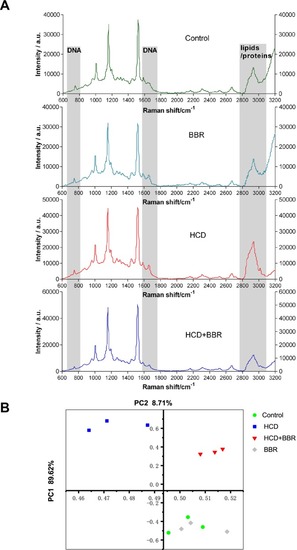
Raman spectral analysis of liver tissue of zebrafish larvae treated with berberine (BBR). (A) Raman spectra obtained from the liver of zebrafish with different treatments. (B) Principal component analysis (PCA) of the spectra extracted from the Raman spectral datasets of the control, BRR(5 μM), HCD, and HCD+BBR (5 μM). Each liver of zebrafish was determined under the microscope at least three different regions for at least three times to acquire the average spectrum.

Effects of berberine (BBR) on the hepatic oxidative stress in high-cholesterol diet (HCD)-induced zebrafish larvae. (A) Liver volume rendering of reactive oxygen species (ROS) staining showed that BBR (5 μM) attenuated hepatic ROS level in HCD-induced Tg (fabp10a: dsRed) zebrafish. ROS generation in the Tg (fabp10a: dsRed) zebrafish liver treated with HCD. Hepatic ROS were detected with CellROX® Green Reagent. Bar = 100 μm. (B) Quantitative analysis of ROS throughout the entire zebrafish liver. Effects of BBR (5 μM) on the glutathione (GSH) (C) and malondialdehyde (MDA) (D) levels in HCD-induced zebrafish larvae. #Compared with the HCD group, P < 0.05.

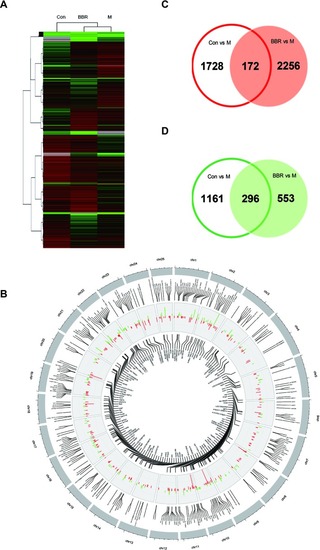
Trend analysis of gene expression patterns in larval zebrafish liver. (A) Cluster analysis of genes and samples from differentially expressed genes (DEGs). (B) The common DEGs in control and BBR groups compared with the HCD group shown by Circos plot. Red color, upregulated genes; green color, downregulated genes. (C) Comparison of upregulated DEGs between different groups. (D) Comparison of downregulated DEGs between different groups.

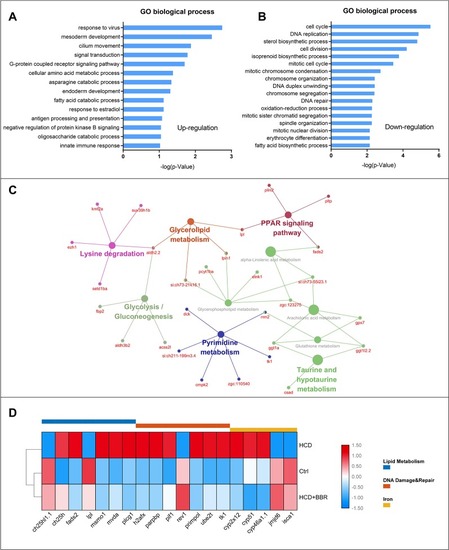
Gene ontology, KEGG enrichment, and functional category analysis. (A) Gene ontology from the upregulated differentially expressed genes (DEGs) (Ctrl vs. M combined 5 μM BBR vs. M). (B) Gene ontology from the downregulated DEGs (Ctrl vs. M combined 5 μM BBR vs. M). (C) KEGG pathway enrichment results for the total DEGs. (D) Gene collection from functional category analysis by DAVID.

Validation of the microarray data using quantitative real-time PCR (qRT-PCR). Relative expression levels of the selected genes determined using qRT-PCR. #Compared with the HCD group, P < 0.05.

Acknowledgments
This image is the copyrighted work of the attributed author or publisher, and ZFIN has permission only to display this image to its users. Additional permissions should be obtained from the applicable author or publisher of the image. Full text @ Front Pharmacol