
- Title
-
Deletion of Gtpbp3 in zebrafish revealed the hypertrophic cardiomyopathy manifested by aberrant mitochondrial tRNA metabolism
- Authors
- Chen, D., Zhang, Z., Chen, C., Yao, S., Yang, Q., Li, F., He, X., Ai, C., Wang, M., Guan, M.X.
- Source
- Full text @ Nucleic Acids Res.

ZFIN is incorporating published figure images and captions as part of an ongoing project. Figures from some publications have not yet been curated, or are not available for display because of copyright restrictions. PHENOTYPE:
|
|
ZFIN is incorporating published figure images and captions as part of an ongoing project. Figures from some publications have not yet been curated, or are not available for display because of copyright restrictions. PHENOTYPE:
|
|
ZFIN is incorporating published figure images and captions as part of an ongoing project. Figures from some publications have not yet been curated, or are not available for display because of copyright restrictions. |
|
ZFIN is incorporating published figure images and captions as part of an ongoing project. Figures from some publications have not yet been curated, or are not available for display because of copyright restrictions. |
|
ZFIN is incorporating published figure images and captions as part of an ongoing project. Figures from some publications have not yet been curated, or are not available for display because of copyright restrictions. |
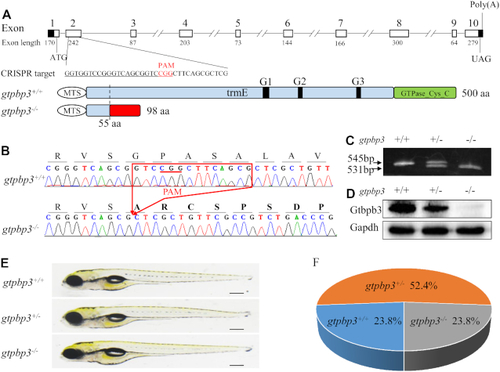
Genome editing of PHENOTYPE:
|
Cardiac defects in zebrafish. ( |
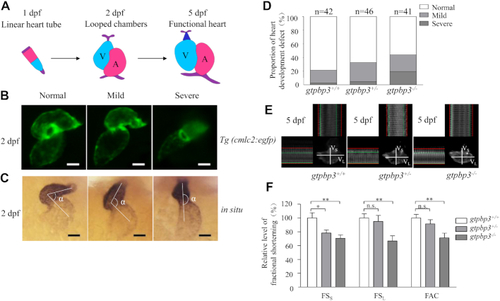
Hypertrophic cardiomyopathy in zebrafish. ( |

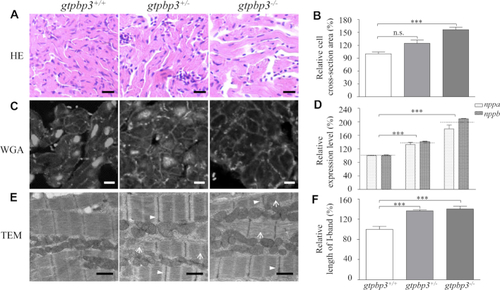
Mitochondrial defects in the zebrafish heart. ( |
|
Unillustrated author statements PHENOTYPE:
|