IMAGE

Figure 8.

ID
ZDB-IMAGE-190723-1790
Source
Figures for Chen et al., 2019
Image
Figure Caption

Figure 8.

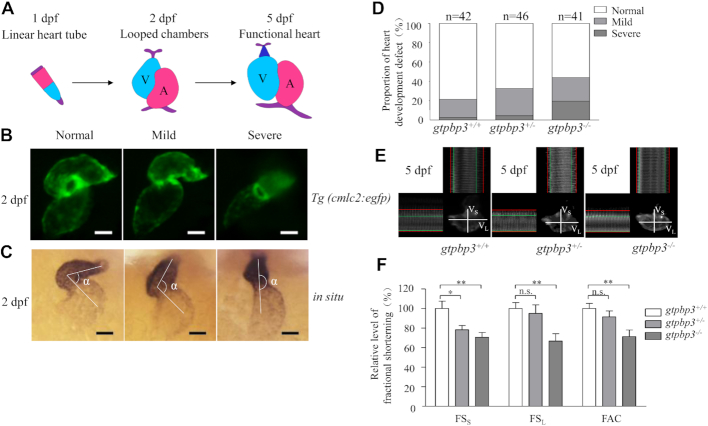
Cardiac defects in zebrafish. (A) Schematic diagram of zebrafish heart development at 1, 2 and 5 dpf. V, ventricle; A, atrium. (B) Tg (cmlc2:egfp) embryos at 2 dpf shows heart-restricted GFP expression in both chambers. (C) Whole-mount in situ hybridization against cmlc2. According to the looping state, measured by the angles between ventricle and atrium, hearts were divided into normal (α<90°), mild (90°<α<180°), and severe (α > 180°). (D) The proportions of each phenotypes in the embryos in mutant and WT zebrafish. (E) Time-lapse images, the ventricular long axis and ventricular short axis were labeled as VL and VS, respectively. End diastolic (red line) and systolic (green line) diameters of zebrafish ventricle at 5 dpf were measured using Olympus software CellSense. (F) The proportions of the short axis fractional shortening (FSS), long axis fractional shortening (FSL) and fractional area change (FAC) in mutant and WT zebrafish. the calculations were based on eight independent determinations. Graph details and symbols are explained in the legend to Figure 4.

Acknowledgments
This image is the copyrighted work of the attributed author or publisher, and ZFIN has permission only to display this image to its users. Additional permissions should be obtained from the applicable author or publisher of the image. Full text @ Nucleic Acids Res.