
- Title
-
Cohesin mediates Esco2-dependent transcriptional regulation in zebrafish regenerating fin model of Roberts syndrome
- Authors
- Banerji, R., Skibbens, R.V., Iovine, M.K.
- Source
- Full text @ Biol. Open
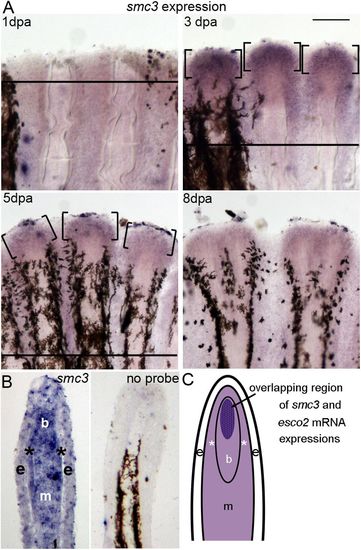
Expression of smc3 in whole-mount and cryosectioned regenerating fins. (A) Expression of smc3 by whole-mount in situ hybridization at various time points (1, 3, 5 and 8 dpa) (n=6 per timepoint). A solid line indicates the amputation plane, except in 8 dpa, where it is out of the field of view. Brackets identify regions of smc3 expression. Scale bar: 50 µm. (B) In situ hybridization on a longitudinal cryosection of a 3 dpa fin showing the tissue-specific localization of smc3 mRNA. Expression is observed in most compartments of the regenerating fin, and appears to be localized strongly in the blastemal compartment (b) with moderate expression in the epidermis (e) and proximal mesenchyme (m), including the skeletal precursor cells (*). The no probe control (right panel) shows no expression of smc3. Melanocytes are observed in the lateral mesenchyme. The amputation plane is out of the field of view. Three independent trials were performed with different fin sections from three different fins. (C) Schematic representation of a longitudinal section of a 3 dpa regenerating fin showing the overlapping expression patterns of esco2 and smc3 mRNA. Lighter purple areas indicate regions of smc3 expression and the dark purple area represents both, smc3 and esco2 expression. EXPRESSION / LABELING:
|
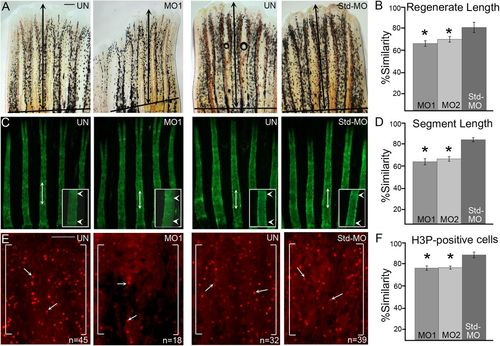
MO-mediated smc3 knockdown results in reduced regenerate length, segment length and cell proliferation. (A) Representative images of uninjected (UN), smc3 MO-injected (MO1) and Std-MO injected fins. Total regenerate length was calculated by measuring the distance between the amputation plane (indicated by a solid black line) to the distal end of the third fin ray (black arrows indicate the length measured). (B) Graph shows the significant reduction (indicated by *) of regenerate length in smc3 knockdown fins (for both MO1 and MO2) compared to the Std-MO injected fins using the percent similarity method. (C) Representative images of calcein stained fins of uninjected (UN), smc3 MO injected (MO1) and Std-MO injected fins. Segment length was calculated by measuring the distance between first two joints in the 3rd fin ray (black arrows indicates the length measured). Higher magnification images of segments are shown with joints indicated by white arrowheads. (D) Graph shows that significant reduction (indicated by *) of segment length in smc3 knockdown (for both MO1 and MO2) compared to Std-MO injected fins using the percent similarity method. (E) Representative images of H3P-positive cells in uninjected (UN), smc3 MO injected (MO1) and Std-MO injected fins. Measurements were taken from the distal most 250 μm of the 3rd ray. White brackets mark the defined area and n represents the number of H3P-positive cells in that area. Arrows identify H3P-positive cells. (F) Graph shows the significant reduction (indicated by *) in the number of H3P-positive cells in smc3 knockdown (for both MO1 and MO2) compared to Std-MO injected fins using the percent similarity method. For each experiment n=8 fins per trial and three independent trials were performed. *P<0.05, two tailed unpaired Student's t-test. Data are mean±s.e.m. Scale bars: 50 µm in A; 100 µm in E. PHENOTYPE:
|

smc3 regulates the expression of cx43 in regenerating fins. (A) Representative image of a fin with the smc3-knockdown side (smc3-MO) showing decreased cx43 staining compared to the uninjected side (UN). Higher magnification of the smc3 knockdown side of the same fin shows reduced levels of cx43 expression compared to the uninjected side), which shows normal cx43 levels. (B) Representative image of Std-MO-injected fin revealing similar cx43 levels in both injected and uninjected sides. Higher magnification of the same fin shows normal and similar levels of cx43 expression in both injected and uninjected sides (UN). For this experiment n=6 fins per trial and three independent trials were performed. The solid line indicates the amputation plane. Scale bars: 100 µm in the upper panel; 50 µm in the lower panel. (C) qPCR confirms the downregulation of cx43 and cx43-dependent target genes (sema3d and hapln1a) following Smc3 knockdown. Fold difference values from the qPCR are shown; a fold difference of 1 is considered as no change with respect to Std-MO-injected fins (indicated by the horizontal line). Three independent Smc3 knockdown samples were prepared. Each sample was tested in duplicates (trials 1-3) for cx43, hapln1a, sema3d, shh, spry4 and mps1 (compared to the internal reference gene, actin). Each of the three trials are denoted by open shapes and the averages are denoted by solid circles. |

ZFIN is incorporating published figure images and captions as part of an ongoing project. Figures from some publications have not yet been curated, or are not available for display because of copyright restrictions. PHENOTYPE:
|
|
ZFIN is incorporating published figure images and captions as part of an ongoing project. Figures from some publications have not yet been curated, or are not available for display because of copyright restrictions. PHENOTYPE:
|
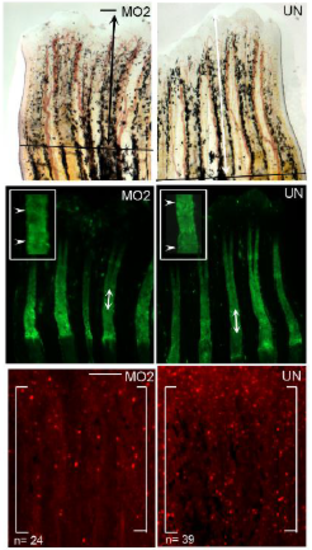
Smc3 knockdown using MO2 results in regenerate length, segment length and cell proliferation reduction. (Top) Representative images of uninjected (UN), smc3 MO injected (MO2) injected fins. Total regenerate length was calculated by measuring the distance between the amputation plane (indicated by a solid black line) to the distal end of the 3rd fin ray (black arrows indicates the length measured). (Middle) Representative images of calcein stained fins of uninjected (UN) and smc3 MO injected (MO2) injected fins. Segment length was calculated by measuring the distance between first two joints in the 3rd fin ray (white arrows indicates the length measured). Higher magnification images of the representing segments are shown with joints indicated by white arrowheads. (Bottom) Representative images of H3P-positive cells in uninjected (UN) and smc3 MO injected (MO2) injected fins. Measurements were taken from the distal most 250μm of the 3rd ray. White bracket marks the defined area and n represents the number of H3P-positive cells in that area. Higher magnification images of the representing H3Ppositive cells are shown indicated by white arrows. For each experiment n=8 fins per trial and 3 independent trials were performed. Scale bar is 50 μm for top and middle panels. Scale bar is 100 μm for the bottom panel. |
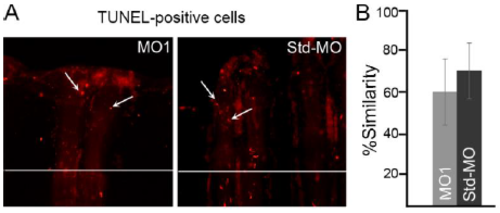
Smc3 knockdown does not increase the level of apoptosis. (A) Representative images of TUNEL-positive cells in MO1-injected and Std-MO injected fins. The MO1/Std-MO were injected in 3 dpa fins and harvested at 1 dpe/4 dpa. TUNEL-positive cells were counted by eye from the distal-most 250μm of the 3rd ray. Arrows identify TUNEL-positive cells and the white horizontal line indicates the plane of amputation. (B) The graph reveals no significant difference between the MO1-injected fins compared to Std-MO injected fins using the percent similarity method. For each experiment n=8 fins. For statistical significance, two tailed unpaired Student's t-test was used where P<0.05. Mean+ s.e.m. is represented by error bars. Scale bar is 50 μm. |
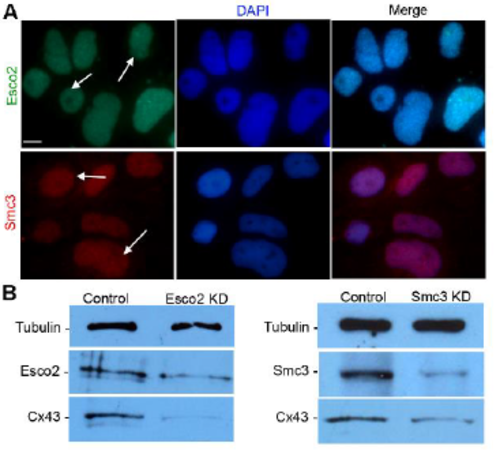
AB9 cells as a system to evaluate cohesin-binding at the cx43 promoter. (A) Expression of Esco2 and Smc3 are detected in AB9 cells by immunofluorescence. The anti-Esco2 antibody and anti-Smc3 antibody stains the nuclei of the cells (DAPI, blue), indicated with arrows. For each protein, 3 independent trials were performed. Scale bar is 10 μm (B) Western blot analysis detects the Esco2 in Std-MO electroporated control cell lysates (Lane1: Control) at a predicted size of 68 kDa. A reduction in Esco2 protein levels in MO1-electroporated esco2 knockdown cell lysate (lane 2: Esco2 KD) was observed when compared to the control sample (lane 1: Control). The results with anti-Cx43 antibody reveals reduced Cx43 protein levels (detected at 43 kDa as predicted) in Esco2 KD compared to control. Western blot analysis detects Smc3 in Std-MO electroporated control cell lysates (lane1: Control) at a predicted size of 142 kDa. A reduction in Smc3 protein levels in MO1-electroporated smc3 knockdown cell lysate (lane 2: Smc3 KD) was observed when compared to the control sample (lane 1: Control). The resultswith anti-Cx43 antibody reveals reduced Cx43 protein levels (detected at 43 kDa as predicted) in Smc3 KD compared to control. Tubulin detected at 50 kDa was used as the loading control for both blots. Image J software was used for analysis of relative band intensity from data of 3 independent trials |