
Fig. S1
- ID
- ZDB-FIG-180501-33
- Publication
- Banerji et al., 2017 - Cohesin mediates Esco2-dependent transcriptional regulation in zebrafish regenerating fin model of Roberts syndrome
- Other Figures
- All Figure Page
- Back to All Figure Page
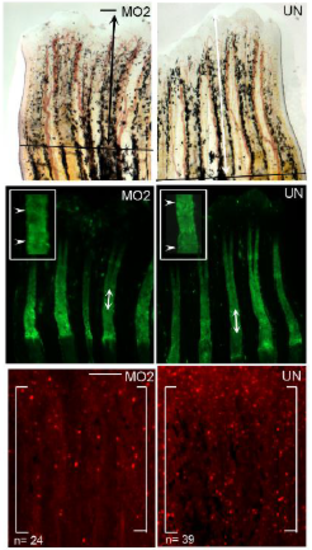
Smc3 knockdown using MO2 results in regenerate length, segment length and cell proliferation reduction. (Top) Representative images of uninjected (UN), smc3 MO injected (MO2) injected fins. Total regenerate length was calculated by measuring the distance between the amputation plane (indicated by a solid black line) to the distal end of the 3rd fin ray (black arrows indicates the length measured). (Middle) Representative images of calcein stained fins of uninjected (UN) and smc3 MO injected (MO2) injected fins. Segment length was calculated by measuring the distance between first two joints in the 3rd fin ray (white arrows indicates the length measured). Higher magnification images of the representing segments are shown with joints indicated by white arrowheads. (Bottom) Representative images of H3P-positive cells in uninjected (UN) and smc3 MO injected (MO2) injected fins. Measurements were taken from the distal most 250μm of the 3rd ray. White bracket marks the defined area and n represents the number of H3P-positive cells in that area. Higher magnification images of the representing H3Ppositive cells are shown indicated by white arrows. For each experiment n=8 fins per trial and 3 independent trials were performed. Scale bar is 50 μm for top and middle panels. Scale bar is 100 μm for the bottom panel. |