
- Title
-
Lmx1b is required for the glutamatergic fates of a subset of spinal cord neurons
- Authors
- Hilinski, W.C., Bostrom, J.R., England, S.J., Juárez-Morales, J.L., de Jager, S., Armant, O., Legradi, J., Strähle, U., Link, B.A., Lewis, K.E.
- Source
- Full text @ Neural Dev.

lmx1b expression in zebrafish spinal cord. a Three-class ANOVA comparison of V0v cells (class 3), trunk cells (class 1) and all post-mitotic neurons (class 2). p values test hypothesis that there is no differential expression among the 3 classes. Columns represent individual microarray experiments. Rows indicate relative expression levels as normalized data, subjected to a Z-transformation where mean = 0 and standard deviation = 1, where red = normalized expression value of +1 and blue = normalized expression value of -1 (see Methods for more details). lmx1ba and lmx1bb are expressed by V0v neurons. Positive control evx1 is also expressed by V0v neurons. Negative controls eng1b and myod1 are expressed by other neurons (V1 cells) and trunk cells respectively. ²actin is a housekeeping gene that is expressed by all populations. b-l Lateral views of zebrafish spinal cord at 27 h (b and c), 30 h (h-l), 36 h (d and e) and 48 h (f and g). Anterior left, dorsal top. in situ hybridization for lmx1ba (b, d and f) and lmx1bb (c, e and g). Black dashed line (b-g) is just below ventral limit of spinal cord, floor plate is right above this, in the most ventral part of the spinal cord, roof plate is the most dorsal part of the spinal cord. Double in situ hybridization for lmx1bb (red) and lbx1a (green) in WT embryo, merged view (h) and magnified single confocal plane of white dotted box region (h′-h′′′). in situ hybridization for lmx1bb (red) and EGFP immunohistochemistry (green) in Tg(evx1:EGFP) SU1 embryo, merged view (i) and magnified single confocal plane of white dotted box region (i′-i′′′). Double in situ hybridization for lmx1bb (red) and slc17a6 (green) in WT embryo, merged view (j) and magnified single confocal plane of white dotted box region (j′-j′′′). in situ hybridization for lmx1bb (red) and EGFP immunohistochemistry (green) in Tg(slc17a6:EGFP) embryo, merged image (k) and magnified single confocal plane of white dotted box region (k′-k′′′). White dashed line (k) marks the dorsal limit of the spinal cord. Red staining above the dashed line is outside the spinal cord. Double in situ hybridization for lmx1bb (red) and slc32a1 (green) in WT embryo, merged image (l) and magnified single confocal plane of white dotted box region (l′-l′′′). In all cases (h-l) * indicates co-labeled cell, x indicates single labeled lmx1bb-expressing cell. In all cases, at least two independent double-labeling experiments were conducted (h-l). Results were similar for each replicate. Numbers of single and double-labeled cells and number of embryos counted are provided in Tables 1 and 2. Scale bar = 50 µm (b-g), 70 µm (h-l) and 20 µm (h′-l′′′) |
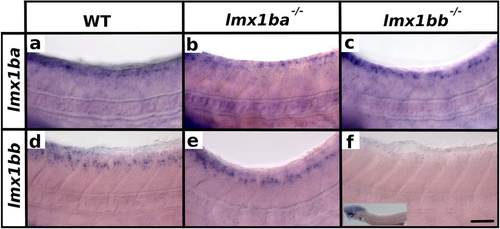
Expression of lmx1b RNAs in lmx1b mutants. Lateral view of zebrafish spinal cord at 48 h (a-f). Anterior left, dorsal top. in situ hybridization of lmx1ba (a-c) or lmx1bb (d-f) in WT (a and d), lmx1ba mutant (b and e) and lmx1bb mutant (c and f). Lower magnification insert in (f) shows expression remaining in hindbrain region. The rest of the head was removed for genotyping. One in situ hybridization of at least 40 embryos was conducted for each of b and e. Two independent in situ hybridizations of at least 50 embryos each were conducted for a, c, d and f. In these cases, results were the same for each replicate experiment. At least three genotyped mutant and wild-type embryos were analyzed in detail for each experiment. Scale bar = 50 µm |

lmx1bb is required for glutamatergic phenotypes at later developmental stages but does not repress inhibitory phenotypes. Lateral view of zebrafish spinal cord at 27 h (a, b, h and i), 36 h (c, d, j and k) and 48 h (e-f′, l, m and o-t), anterior left, dorsal top. in situ hybridization for slc17a6a + slc17a6b (slc17a6) (a-f′), slc32a1 (h-m), gad1b + gad2 (GAD) (o, p), slc6a5 (q and r) and pax2a (s and t). (e′ and f′) are magnified views of black dashed box region in (e and f) respectively. Mean number of cells (y-axis) expressing markers slc17a6 (g), slc32a1 (n) and GAD, slc6a5 or pax2a at 48 h (u) in spinal cord region adjacent to somites 6–10 in WT embryos (white) and lmx1bb homozygous mutants (grey) (x-axis). Statistically significant (p < 0.05) comparisons are indicated with square brackets and stars. Error bars indicate standard error of the mean. Two independent experiments were conducted for all slc17a6 and slc32a1 experiments (a-m). Cells count results were similar for each replicate. One experiment was conducted for (o-t). Cell count data presented here (g, n and u) are average values for 4 to 17 embryos from the same in situ hybridization experiment. Precise numbers of embryos counted and p values are provided in Tables 3 and 4. Scale bar = 50 µm (a-f, h-m and o-t) and 25 µm (e′ and f′) |
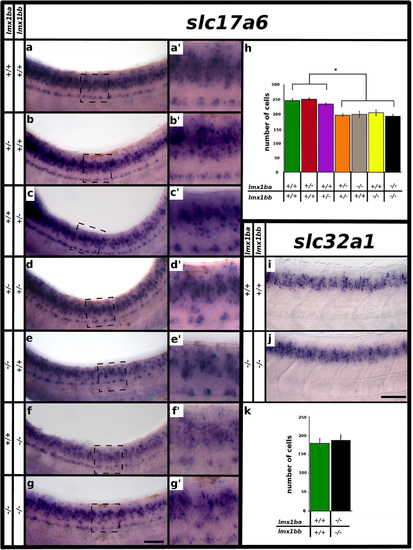
Three functional lmx1b alleles are required for correct numbers of glutamatergic cells at later developmental stages. Lateral view of zebrafish spinal cord at 48 h (a-g′, i and j), anterior left, dorsal top. in situ hybridization for slc17a6a + slc17a6b (slc17a6) (a-g′) and slc32a1 (i and j). (a′-g′) are magnified views of black dashed box regions in panels (a-g). Columns on left indicate lmx1ba and lmx1bb genotype. Mean number of cells (y-axis) expressing slc17a6 (h) and slc32a1 (k) in spinal cord region adjacent to somites 6-10 at 48 h (x-axis). Square brackets and star in (h) indicates that each of the first three columns is statistically significantly different from each of the last four columns (p < 0.05). Embryo genotype is indicated below graph. Error bars indicate standard error of the mean. Two independent experiments were conducted for (a-g). Cell count results were similar in each replicate. One experiment was conducted for (i and j). Cell count data presented here (h and k) are average values of 4-13 embryos. Precise numbers of embryos counted and p values are provided in Table 5. Scale bar (g) = 50 µm (a-g) and 20 µm (a′-g′) and scale bar (j) = 50 µm (i, j) |
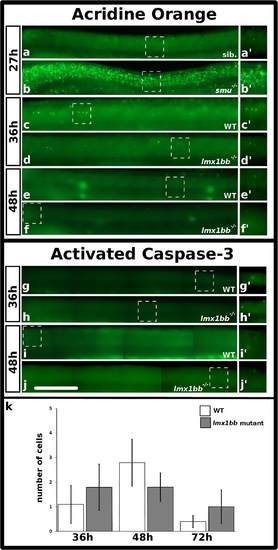
There is no increase in apoptosis in lmx1bb mutants between 36 h and 72 h. Lateral view of zebrafish spinal cord at 27 h (a-b′), 36 h (c-d′ and g-h′) and 48 h (e-f′ and i-j′), anterior left, dorsal top. Acridine orange (AO) treatment (a-f′) and activated caspase-3 immunohistochemistry as anterior-posterior montages (g-j′). Sib. in (a) is a sibling embryo to smoothened mutant in (b). (a′-j′) are magnified view of corresponding boxed region. Mean number of cells (y-axis) with activated caspase-3 staining in WT embryos (white) and lmx1bb homozygous mutants (grey) (x-axis) at indicated developmental times. Error bars indicate standard error of the mean. Two independent experiments were conducted for (c-j). Expression (a-j) and cell count data (k) were similar in each replicate. Data presented in (k) are average values of 5-8 embryos from the same experiment. Precise number of embryos counted and p values are provided in Table 6. Scale bar = 100 µm (a-j) and 80 µm (a′-j′) PHENOTYPE:
|
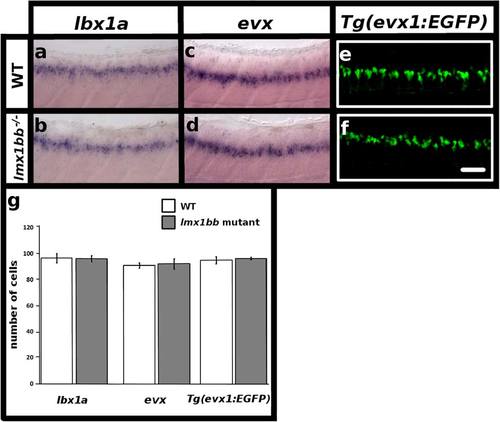
lmx1bb is expressed by dI5 and V0v neurons and these cells form in normal numbers in lmx1bb mutants. Lateral view of zebrafish spinal cord at 48 h (a-f), anterior left, dorsal top. in situ hybridization for lbx1a in WT (a) and lmx1bb homozygous mutant (b) embryos. in situ hybridization for evx1 + evx2 (evx) in WT (c) and lmx1bb homozygous mutant (d) embryos. Immunohistochemistry for EGFP in Tg(evx1:EGFP) SU1 WT (e) and lmx1bb homozygous mutant (f) embryos. g Mean number of cells (y-axis) in WT embryos (white) and lmx1bb homozygous mutants (grey) expressing lbx1a, evx or Tg(evx1:EGFP) SU1 in spinal cord region adjacent to somites 6-10 (x-axis). Two independent experiments were conducted for (a-f). Cell count results were similar in each replicate. Data shown here (g) are average values of 6-10 embryos from the same experiment. Precise number of embryos counted and p values are provided in Table 4. Error bars indicate standard error of the mean. Scale bar = 50 µm (a-f) |
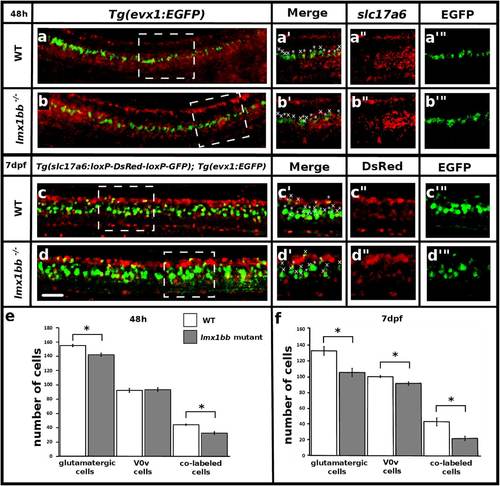
lmx1bb is required for V0v interneuron glutamatergic fates at later stages of development. Lateral view of zebrafish spinal cord at 48 h (a and b) and 7 dpf (c and d), anterior left, dorsal top. in situ hybridization slc17a6 (red) and EGFP immunohistochemistry (green) in WT (a) and lmx1bb mutant (b) Tg(evx1:EGFP) SU1 embryos. Single magnified confocal plane from white dashed box region (a′-a′′′ and b′-b′′′). Immunohistochemistry for EGFP (green) and DsRed (red) in WT (c) and lmx1bb mutant (d) Tg(slc17a6b(vglut2a):loxP-DsRed-loxP-GFP) nns14 ;Tg(evx1:EGFP) SU1 embryos. Single magnified confocal plane from white dashed box region (c′-c′′′ and d′-d′′′). * indicates co-labeled cell, x indicates single labeled EGFP-expressing (V0v) cell. (e and f) Mean number of cells (y-axis) expressing slc17a6 or DsRed (glutamatergic), EGFP (V0v) and slc17a6 or DsRed + EGFP (co-labeled) (x-axis) in WT (white) and lmx1bb homozygous mutants (grey). Error bars indicate standard error of the mean. Three independent experiments were conducted for (c and d). Cell count results were similar in each replicate. One experiment was conducted for (a and b). Data shown here (e and f) are average values of 5–12 embryos. Precise number of embryos counted and p values are provided in Table 7. The glutamatergic and V0v numbers include co-labeled cells. Statistically significant (p < 0.05) comparisons are indicated with square brackets and stars. Scale bar = 30 µm (a-d) and 25 µm (a′-d′′′) |
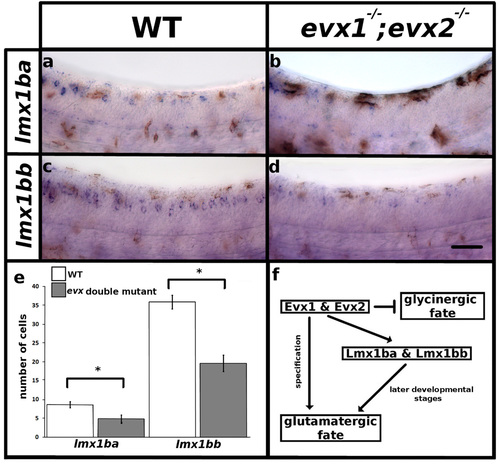
Evx1 and Evx2 are required for lmx1b expression. Lateral view of zebrafish spinal cord at 30 h (a-d), anterior, left dorsal top. in situ hybridization for lmx1ba (a, b) and lmx1bb (c, d). Brown coloration in (a-d) is pigment from melanocytes. e Mean number of cells (y-axis) that express lmx1ba and lmx1bb in WT (white) and evx1;evx2 double mutants (grey) (x-axis). Error bars indicate standard error of the mean. Statistically significant (p < 0.05) comparisons are indicated with square brackets and stars. One experiment was conducted for (a and b). Two independent experiments were conducted for (c and d) and cell count results were similar in each replicate. Data presented here (e) are average values for 5-12 embryos. Precise number of embryos counted and p values are provided in Table 8. f. Proposed mechanism for how the excitatory (glutamatergic) neurotransmitter phenotype of at least a subset of V0v neurons is specified and/or maintained. We previously demonstrated that Evx1 & Evx2 specifies the excitatory (glutamatergic) neurotransmitter phenotype and represses inhibitory (glycinergic) phenotypes in V0v cells [11]. The current study demonstrates that Evx1 & Evx2 are also required for lmx1ba and lmx1bb expression. Furthermore, we show that Lmx1bb is required at later developmental stages either to maintain the excitatory (glutamatergic) neurotransmitter phenotype for at least a subset of V0v neurons or to specify the glutamatergic phenotype of a later-forming subset of V0v cells. Scale bar = 50 µm |