
- Title
-
Esco2 regulates cx43 expression during skeletal regeneration in the zebrafish fin
- Authors
- Banerji, R., Eble, D.M., Iovine, M.K., Skibbens, R.V.
- Source
- Full text @ Dev. Dyn.
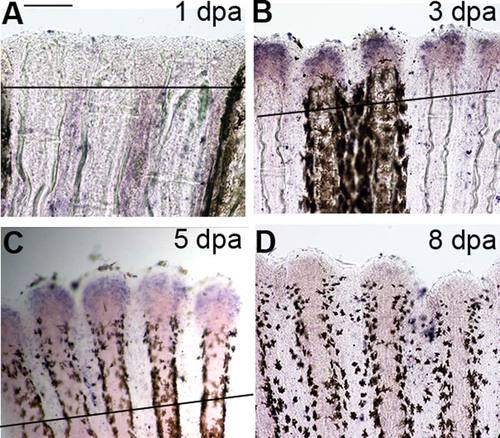
Time course in situ hybridization of esco2 in whole-mount regenerating fins. A: esco2 expression in 1 day postamputated (dpa) regenerating fins was largely not detectable. B,C: esco2 expression in 3 dpa regenerating fins was strongly detected at the distal end (B) and began to gradually decline in 5 dpa regenerating fins (C). D: Expression of esco2 was reduced in regenerating fins by 8 dpa. The amputation plane is indicated by a solid line except in 8 dpa regenerating fin (D), where it is out of the field of view. Scale bar = 50 µm. |
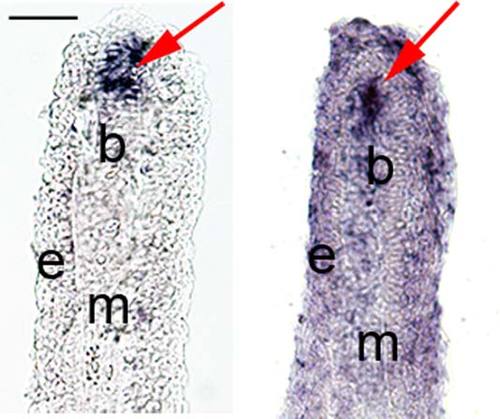
In situ hybridization of esco2 in fin cryosections. Left: Cryosection from a whole-mount WT-5 dpa fin treated for in situ hybridization showing tissue specific expression of esco2 mRNA within the blastema compartment. Right: In situ hybridization was completed on a WT-5 dpa fin cryosection showing a similar pattern of esco2 expression localized specifically at the blastemal region. Arrows indicate esco2 expression at blastema. B, blastemal; e, epidermis; m, mesenchyme. Scale bar = 50 µm. |
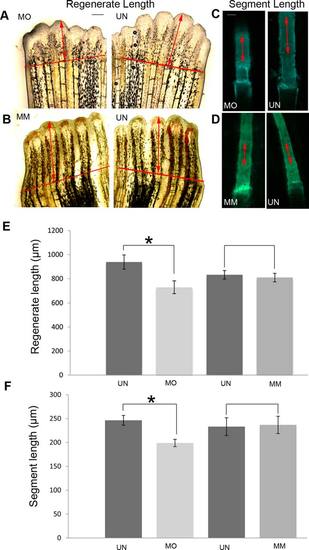
Morpholino mediated esco2-knockdown phenotypes include reduction in regenerate length and bone segment length. A: Representative images showing decreased regenerate length in esco2 morpholino (MO) injected half compared with the uninjected (UN) half of the same fin. B: Representative images showing similar levels of regeneration in fins injected with esco2 mismatch (MM) MO compared with the UN half of the same fin. The red line indicates the amputation plane. Arrows indicate the distance from the amputation plane to the distal end of the 3rd fin ray. C: Representative images of calcein stained segments of the 3rd fin ray show shorter bone segments in MO-injected fin half compared with the UN half of the same fin. D: Representative images of calcein stained segments of the 3rd fin ray of MM-injected and UN fins reveal bone segments of similar lengths. For all experiments 6–8 fish were used per trial and at least 3 independent trials were performed. The MO/MM was injected/electroporated in 3 dpa fins and was allowed to regenerate for 4 days. For regenerate length and segment length measurements the fins were calcein stained at 4 dpe/7 dpa. For calcein staining, fish were allowed to swim for 10 min in 0.2% calcein (pH 7) at room temperature followed by fresh system water for another 10 min. E: Graph reveals significant reduction (*) in regenerate length in MO treated fins compared with UN fins. Regenerate length of MM treated fins and UN fins show no significant differences in length. F: Graph shows significant reduction (*) in segment length between MO treated fins and UN fins. The segment length of MM treated fins and UN fins show no significant difference. Student′s t-test was used for determining statistical significance where P < 0.05. Standard error is represented by error bars. Scale bar = 50 µm. PHENOTYPE:
|
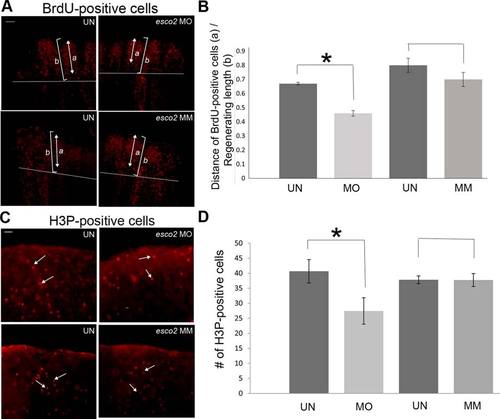
Role of esco2 in cell proliferation. A: (Top) Representative images of BrdU-positive cells in uninjected (UN) and esco2-MO injected (MO) fins. (Bottom) Representative images of BrdU-positive cells in uninjected (UN) and MM injected fins. Briefly, the MO/MM was injected/electroporated in 3 dpa fins and the next day (1 dpe/4 dpa) the fish were allowed to swim in 50 µg/ml BrdU water for 5 mins and then harvested. For all the experiments at least 6–8 fins were used per trial and at least 3 independent trials were performed. The arrow indicates the span of the BrdU-positive cells from the tip of the 3rd fin ray (a) and the bracket indicates total regenerate length of the 3rd fin ray (b) The amputation plane is shown by a horizontal line. B: Graph shows the significant reduction (*) in a/b ratio of BrdU-positive cells in MO injected fins compared with the UN fins. The difference between the MM treated fins and the UN fins is not significantly different. Student′s t-test was used for determining statistical significance where P < 0.05. Standard error is represented by error bars. Scale bar = 100 µm. C: (Top) Representative images of H3P-positive cells in uninjected (UN) and esco2-MO injected (MO) fins. (Bottom) Representative images of H3P-positive cells in uninjected (UN) and MM injected fins. The arrows indicate single H3P-positive cells. At least 6–8 fins were used per trial and 3 independent trials were performed. The MO/MM was injected in 3 dpa fins and harvested at 1 dpe/4 dpa. H3P-positive cells were counted by eye from within the distal-most 250 µm of the 3rd fin ray as previously established. D: Graph shows the significant reduction (*) in the average number of H3P-positive cells in MO injected fins compared with the UN fins. The difference between the MM treated fins and the UN fins is not significantly different. Student′s t-test was used for statistical analysis where P < 0.05. Standard error is represented by error bars. Scale bar = 50 µm. PHENOTYPE:
|
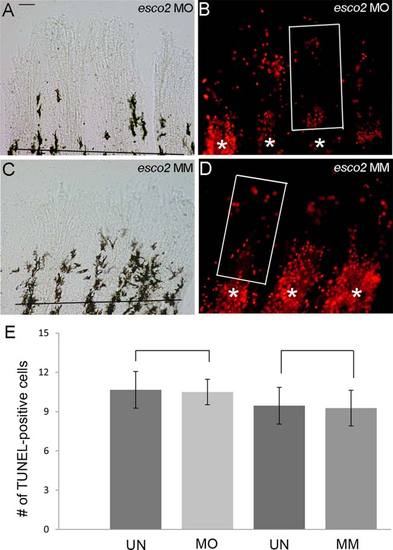
Role of esco2 in programmed cell death. A,B: Representative bright-field image (A) and TUNEL-positive cells (B) in esco2-MO injected fins. C,D: Representative bright-field image (C) and TUNEL-positive cells (D) in MM injected fins. At least 6–8 fins were used per trial and 3 independent trials were performed. The MO/MM were injected in 3 dpa fins and harvested at 1 dpe/4 dpa (uninjected control halves not shown). TUNEL-positive cells were counted by eye from within the distal-most 250 µm of the 3rd fin ray. The amputation plane is shown by a horizontal line and * indicates the individual fin rays. High levels of TUNEL-positive cells located at the amputation plane serve as an internal control for staining. The box represents the area used to count the cells. (E) Graph shows similar average numbers of TUNEL-positive cells in either MO injected fins or the MM injected fins, compared with the UN fins. Student′s t-test was used for determining statistical significance where P < 0.05. Standard error is represented by error bars. Bracketed comparisons were not significant. Scale bar = 50 µm. |
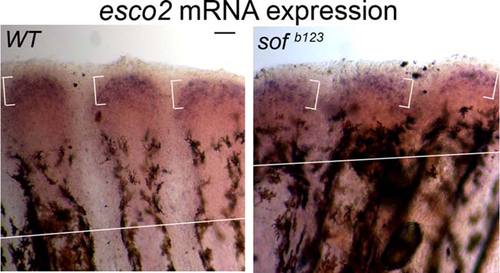
Figure 8. Expression of esco2 mRNA in WT and short fin (sof b123) fins by whole-mount in situ hybridization. WT and sof b123 fins were amputated at 50% level and allowed to regenerate for 5 days. At 5 dpa, the fins were harvested. At least six to eight fins were used per trial and 3 independent trials were performed. Left: Whole-mount in situ hybridization (ISH) on WT-5 dpa regenerating fins showing esco2 expression. Right: Whole-mount ISH on sof b123 -5 dpa regenerating fins shows similar expression levels of esco2. The brackets represent the zone of esco2 expression. Scale bar = 50 µm. EXPRESSION / LABELING:
|

In situ hybridization on morpholino mediated esco2-knockdown fins shows reduced levels of cx43 expression. The MO/MM was injected in 3 dpa fins and fins were harvested at 1 dpe/4 dpa. The amputation plane is identified by black lines unless it is out of the field of view (i.e., as occurs in most of the higher magnification images). The fin in panel A appears curved because there was less growth on the esco2-knockdown side compared with the uninjected side. A: (Top) Representative image of a fin with esco2-knockdown side (esco2 MO) showing decreased staining of cx43, compared with the uninjected side (UN). (Bottom left) Higher magnification of the knockdown side (MO) of the same fin (fin rays from top image marked by *) showing reduced cx43 expression. (Bottom right) Higher magnification of the uninjected side (UN) of the same fin (fin rays from top image marked by +) showing robust cx43 expression. B: (Top) Representative image of a fin microinjected with esco2-MM in one half and the other side uninjected (UN) reveal similar levels of cx43. (Bottom left) Higher magnification of the esco2-MM injected side (MM) of the same fin (fin rays from top image marked by *) showing cx43 expression. (Bottom right) Higher magnification of the uninjected side (UN) of the same fin (fin rays from top image marked by +) showing similar cx43 expression levels. Scale bar = 100 µm. |

cx43 and cx43-dependent target genes are reduced following esco2-knockdown. The fold difference values from qRT-PCR are shown. A fold difference of 1 indicates no change with respect to standard MO treated fins. Three independent esco2-knockdown (KD) samples were prepared. Each sample was tested in duplicate (trials 1–3) for cx43, sema3d, hapln1a, shh, spry4, and mps1, and compared with the internal reference gene. The individual trials are represented by circles and the averages are represented by solid circles. |

Up-regulation of both cx43 mRNA and Cx43 protein in regenerating fins of the transgenic line treated for heat shock. A: Expression of cx43 mRNA in transgenic hsp70:miR-133sp pd48-positive with heat shock (Tg+HS+) and hsp70:miR-133sp pd48-negative with heat shock (Tg-HS+) fins by whole-mount ISH. The Tg+HS + fins show a higher expression of cx43 mRNA compared with Tg-HS + fins. The brackets mark the zone of cx43 expression in each fin ray and the horizontal line represents the amputation plane. Scale bar = 50 µm. B: Western blot reveals a 50% increase of Cx43 protein levels (normalized to tubulin) in fin lysates of Tg+HS + compared with Tg-HS+. Tubulin was used as a loading control. The bands marked were used for relative band intensity analysis using the gel analysis tool (ImageJ software). C: Expression of esco2 mRNA in transgenic hsp70:miR-133sp pd48-positive with heat shock (Tg+HS+) and hsp70:miR-133sp pd48-negative with heat shock (Tg-HS+) fins by whole-mount ISH. Tg+HS + and Tg-HS + fins show similar expression level of esco2 mRNA. The brackets mark the zone of esco2 expression in each fin ray and the horizontal line represents the amputation plane. Scale bar = 50 µm. D: Western blot reveals the Esco2 protein expression (normalized to tubulin) is nearly similar (90%) in fin lysates of Tg+HS + and Tg-HS+. Tubulin was used as a loading control. The single band marked was used for relative band intensity analysis using the gel analysis tool (ImageJ software). |

Overexpression of cx43 rescues esco2 knockdown phenotypes. A: Figure depicting the timeline of fin amputation, morpholino injection and electroporation, heat shock, and data analysis. The 3 groups included in this experiment were Tg+HS- (transgenic hsp70:miR-133sp pd48-positive, heat shock), Tg-HS + (transgenic hsp70:miR-133sp pd48-negative, heat shock) and Tg+HS- (transgenic hsp70:miR-133sp pd48-positive, not heat shocked). Briefly, fins from all three groups were amputated at 50% level and allowed to regenerate for 3 days. At 3 dpa, morpholino was injected to one half of the regenerating fin tissue, immediately followed by electroporation on both sides. After an interval of 4 hr fish receiving heat shock were shifted to 37°C for 1 hr. Induction of the transgene expression upon heat shock was confirmed after 24 hr by screening for GFP-positive fins in the Tg+HS + group. The control groups (Tg-HS + and Tg+HS-) were negative for GFP expression. For ISH experiments, the fins were harvested at 1 dpe/4 dpa. For measurement of regenerate length and segment length, fins were calcein stained at 4 dpe/7 dpa. For each experiment, at least 6–8 fish were used per trial and at least 3 independent trials were performed. B: Graph reveals significant (*) rescue of esco2-dependent segment length defects in heat shock miR-133sp pd48 -positive esco2-knockdown fins (Tg+HS+) compared both with heat shock transgene-negative (Tg-HS+) and with miR-133sp pd48 -positive with no heat shock (Tg+HS-). Measurements from the injected side and the uninjected side of the same fin were used to calculate percent similarity and the average was calculated for each group. Note that a percent similarity of 100% indicates no difference between the knockdown side and the control sides of the fin. Student's t-test was used for determining statistical significance where P < 0.05. Standard error is represented by error bars. (C) Graph reveals significant (*) rescue of esco2-dependent regenerate length defects in heat shocked miR-133sp pd48 -positive esco2-knockdown fins (Tg+HS+) compared both with heat shocked transgene-negative (Tg-HS+) and with miR-133sp pd48 -positive in the absence of heat shock (Tg+HS-). Measurements from the injected side and the uninjected side of the same fin were used to calculate percent similarity and the average was calculated for each group. Note that a percent similarity of 100% indicates no difference between the knockdown side and the control sides of the fin. Student's t-test was used for determining statistical significance where P < 0.05. Standard error is represented by error bars. PHENOTYPE:
|