
|
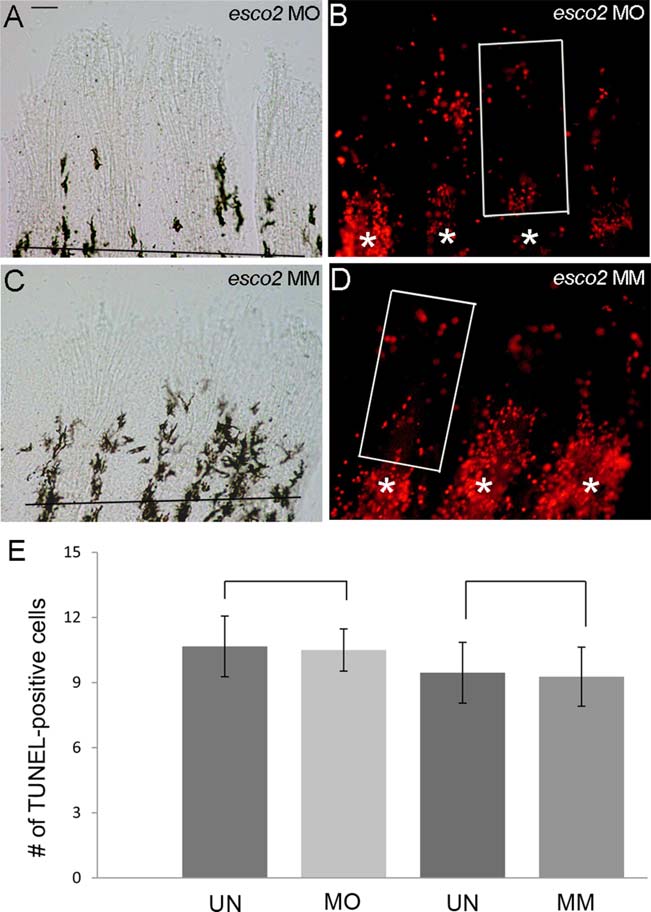
Fig. 7
Role of esco2 in programmed cell death. A,B: Representative bright-field image (A) and TUNEL-positive cells (B) in esco2-MO injected fins. C,D: Representative bright-field image (C) and TUNEL-positive cells (D) in MM injected fins. At least 6–8 fins were used per trial and 3 independent trials were performed. The MO/MM were injected in 3 dpa fins and harvested at 1 dpe/4 dpa (uninjected control halves not shown). TUNEL-positive cells were counted by eye from within the distal-most 250 µm of the 3rd fin ray. The amputation plane is shown by a horizontal line and * indicates the individual fin rays. High levels of TUNEL-positive cells located at the amputation plane serve as an internal control for staining. The box represents the area used to count the cells. (E) Graph shows similar average numbers of TUNEL-positive cells in either MO injected fins or the MM injected fins, compared with the UN fins. Student′s t-test was used for determining statistical significance where P < 0.05. Standard error is represented by error bars. Bracketed comparisons were not significant. Scale bar = 50 µm.