
Fig. 6
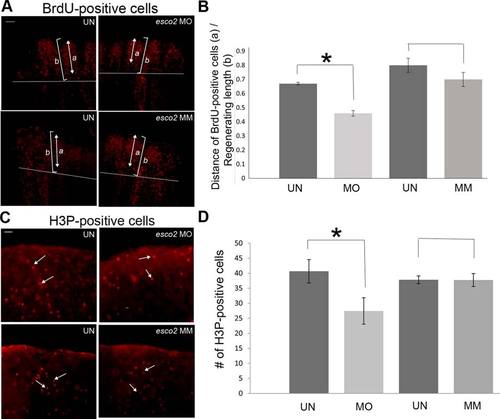
Role of esco2 in cell proliferation. A: (Top) Representative images of BrdU-positive cells in uninjected (UN) and esco2-MO injected (MO) fins. (Bottom) Representative images of BrdU-positive cells in uninjected (UN) and MM injected fins. Briefly, the MO/MM was injected/electroporated in 3 dpa fins and the next day (1 dpe/4 dpa) the fish were allowed to swim in 50 µg/ml BrdU water for 5 mins and then harvested. For all the experiments at least 6–8 fins were used per trial and at least 3 independent trials were performed. The arrow indicates the span of the BrdU-positive cells from the tip of the 3rd fin ray (a) and the bracket indicates total regenerate length of the 3rd fin ray (b) The amputation plane is shown by a horizontal line. B: Graph shows the significant reduction (*) in a/b ratio of BrdU-positive cells in MO injected fins compared with the UN fins. The difference between the MM treated fins and the UN fins is not significantly different. Student′s t-test was used for determining statistical significance where P < 0.05. Standard error is represented by error bars. Scale bar = 100 µm. C: (Top) Representative images of H3P-positive cells in uninjected (UN) and esco2-MO injected (MO) fins. (Bottom) Representative images of H3P-positive cells in uninjected (UN) and MM injected fins. The arrows indicate single H3P-positive cells. At least 6–8 fins were used per trial and 3 independent trials were performed. The MO/MM was injected in 3 dpa fins and harvested at 1 dpe/4 dpa. H3P-positive cells were counted by eye from within the distal-most 250 µm of the 3rd fin ray as previously established. D: Graph shows the significant reduction (*) in the average number of H3P-positive cells in MO injected fins compared with the UN fins. The difference between the MM treated fins and the UN fins is not significantly different. Student′s t-test was used for statistical analysis where P < 0.05. Standard error is represented by error bars. Scale bar = 50 µm. |
| Fish: | |
|---|---|
| Condition: | |
| Knockdown Reagent: | |
| Observed In: | |
| Stage: | Adult |