
- Title
-
Ethanol metabolism and oxidative stress are required for unfolded protein response activation and steatosis in zebrafish with alcoholic liver disease
- Authors
- Tsedensodnom, O., Vacaru, A.M., Howarth, D.L., Yin, C., and Sadler, K.C.
- Source
- Full text @ Dis. Model. Mech.
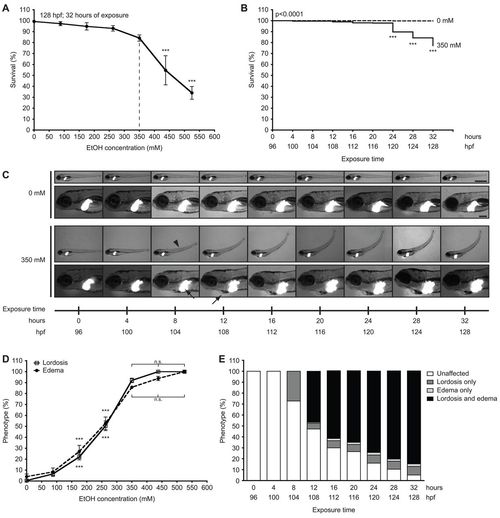
Concentrations of ethanol exceeding 350 mM reduce survival and induce multisystemic morphological abnormalities in 4 dpf larvae. (A) Larvae at 96 hpf were exposed to 0 mM, 87.5 mM (0.5%), 175 mM (1.0%), 262.5 mM (1.5%), 350 mM (2.0%), 437.5 mM (2.5%) and 525 mM (3.0%) ethanol and scored for viability at 128 hpf; mean ± s.e.m. n=6 clutches, n=125 larvae per treatment; ***P<0.001 versus 0 mM. The dashed line indicates the optimal concentration. (B) Kaplan-Meier survival curve of larvae exposed to 0 mM or 350 mM ethanol for 32 hours and scored for survival at every 4 hours; n=13 clutches, n=562 larvae per cohort. The P-value is indicated as determined by log-rank test; ***P<0.001 versus 96 hpf in 350 mM curve. (C) Images of one Tg(fabp10:dsRed) larva during exposure to 0 mM ethanol and another during exposure to 350 mM ethanol from 96 to 128 hpf. Arrowhead indicates lordosis at 104 hpf; arrows indicate hepatomegaly at 104 hpf and pericardial edema at 108 hpf. Scale bars: 1 mm in the upper panels and 0.2 mm in the lower panels. (D) Lordosis and edema were scored in larvae that survived 32-hour exposure to ethanol at concentrations of 0–525 mM; mean ± s.e.m. n=6 clutches, n=100 larvae. Except for the 87.5 mM ethanol group, all concentration points on both curves are significantly different (***P<0.001) compared with 0 mM. There is no significant (n.s.) difference in the percent of lordosis and edema in larvae treated with 350 mM ethanol or greater. (E) Morphological changes during 32 hours of exposure to 350 mM ethanol were averaged from ten clutches (n=442 per group). The percent of unaffected larvae was significantly reduced at all time points starting at 8 hours of exposure; the percent of larvae with lordosis alone was significantly increased from 8 hours of exposure; and the percent of larvae with both lordosis and edema was significantly increased at 12 hours of exposure and later; P<0.001. Untreated larvae (n=442) scored in parallel did not display any of these phenotypes at any time points (not shown). All statistical significance, except where indicated, was calculated by one-way ANOVA and Tukey’s post-hoc test. PHENOTYPE:
|
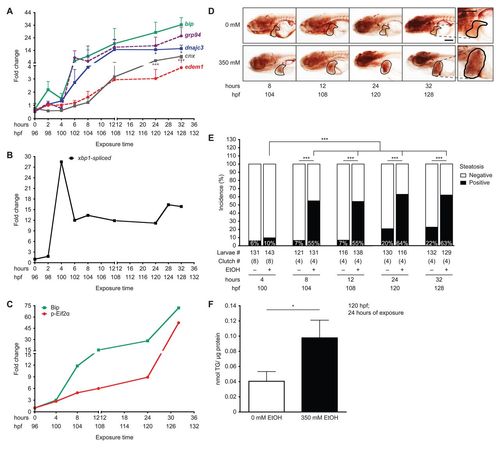
Ethanol-induced UPR in the liver precedes steatosis. (A) qPCR on cDNA prepared from pools of livers dissected from larvae exposed to 350 mM ethanol at 96–128 hpf. Fold changes were calculated by normalizing the comparative threshold (CT) values calculated as 2CT(target)/2CT(rpp0) to the ones obtained from 0 mM. ***P<0.001 and *P<0.05 by one-way ANOVA and Tukey’s post-hoc test. (B) Fold change in the percent of spliced xbp1 from the total xbp1 message present in liver cDNA from larvae exposed to 350 mM ethanol versus untreated controls, based on the PCR shown in supplementary material Fig. S2A. (C) Fold change in Bip protein levels and Eif2α phosphorylation normalized to β-actin was determined from the immunoblots in supplementary material Fig. S2B. (D) Representative images of whole-mount oil red O staining in larvae exposed to 0 or 350 mM ethanol at the indicated times. The livers are circled. The 32-hour image is enlarged to illustrate the lipid droplets used to score steatosis. Scale bar: 0.2 mm. (E) Average percent of steatosis across 4–8 clutches of larvae exposed to 0 (–) or 350 (+) mM ethanol. ***P<0.0001 by Fisher’s exact test. (F) Average triglyceride (TG) levels (nmol) in livers of larvae exposed to 0 or 350 mM ethanol for 24 hours were normalized to total protein (μg). Mean ± s.e.m. n=4 clutches, *P<0.05 by a Student’s t-test. |
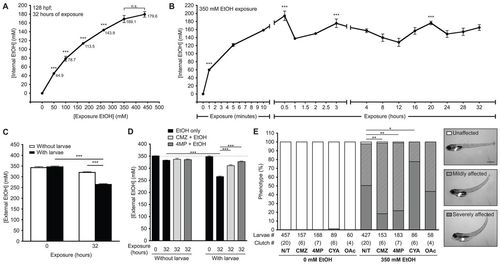
Ethanol is rapidly internalized, utilized and metabolized in zebrafish larvae. (A) Internal ethanol concentration was measured in homogenates of whole larvae treated with the indicated ethanol concentrations at 96–128 hpf. Values are in mM; mean ± s.e.m. n=6 clutches, n=260 larvae. All concentration points are statistically significant (***P<0.001) from the controls. Samples labeled as n.s. did not differ from one another. (B) Internal ethanol concentration determined from whole larvae treated with 350 mM ethanol for the indicated durations; mean ± s.e.m. n=6 clutches, n=200 larvae. All time points on the curve are significantly different (P<0.001) from t=0. ***P<0.001 versus t=32 hours. (C) Ethanol internalization and consumption was measured by calculating the external (water) ethanol concentration at t=0 and t=32 hours of larval exposure. To account for ethanol evaporation, concentration was also calculated from media that lacked larvae and was maintained in parallel. Values are the average of triplicate measurements of samples obtained from four clutches (mean ± s.e.m.); ***P<0.001. (D) The effects of CMZ and 4MP on ethanol utilization was measured in naïve larvae (black bars) or larvae pre-treated with 100 μM CMZ (light gray) or 1 mM 4MP (dark gray) at 94 hpf and then co-exposed to 350 mM ethanol from 96 to 128 hpf at a density of 1 larva/ml. Dashed line marks 350 mM ethanol. Values were calculated from triplicate measurements on three clutches (mean ± s.e.m.). ***P<0.001. (E) Untreated larvae (N/T) and larvae pre-treated with 100 μM CMZ, 1 mM 4MP, 3 mM CYA or 40 mM OAc at 94 hpf and then co-exposed with one of these drugs and 350 mM ethanol from 96 to 120 hpf were scored for mild or severe phenotypes, as shown in the representative images in the panels on the right. The severely affected phenotype (gray bars) was significantly reduced in larvae co-treated with CMZ or 4MP, but increased with CYA. *P<0.05 and **P<0.01. Statistics in all panels were calculated by one-way ANOVA and Tukey’s post-hoc test. |
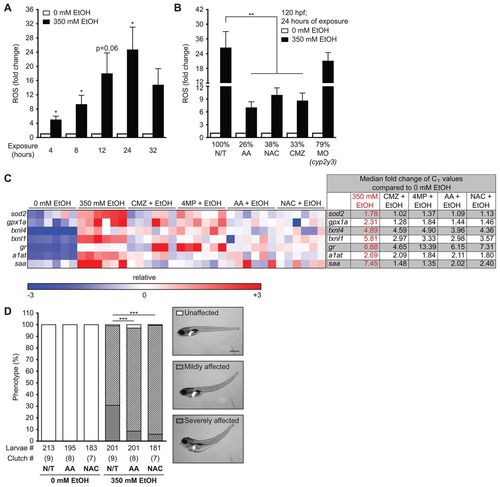
Ethanol-induced ROS production and morphological abnormalities in zebrafish are rescued by antioxidants and inhibitors of ethanol metabolism. (A) ROS production was measured by assaying CM-H2DCFDA fluorescence in the media during exposure to 350 mM ethanol. The arbitrary units of fluorescence measured in duplicate from larvae treated with 350 mM ethanol were normalized to corresponding untreated fish and the average fold changes of four clutches are shown. *P<0.05 as determined by a one-sample Student’s t-test. (B) Larvae were either pre-treated with 125 μM AA, 20 μM NAC or 100 μM CMZ at 94 hpf or injected with 4–6 nl of 0.1 mM cyp2y3 morpholino at 0 hpf and then exposed to 350 mM ethanol at 96 hpf for 24 hours. **P<0.01 by one-way ANOVA and Tukey’s post-hoc test. (C) A heatmap of relative expression based on qPCR from cDNA isolated from the livers of larvae exposed to 350 mM ethanol alone or co-treated with CMZ, 4MP, AA or NAC for 24 hours. Each row is a gene and each column is a single clutch, and the color range (red – high, blue – low) was determined via the median method in GENE-E. CMZ, 4MP, AA and NAC treatments alone did not affect the expression of these genes when compared with untreated larvae (0 mM) and thus are not shown. The fold changes of the median CT values of six clutches are shown to the right and individual CT values are in supplementary material Table S2. The median was calculated for each row (gene) and subtracted from each data point. All six clutches are aligned according to the order of the lowest (blue) to the highest (red) expression of sod2 in 350 mM ethanol treatment. (D) Representative images of unaffected, and mildly or severely affected larvae are shown on the right. The phenotypes were scored in an average of nine clutches (n=210 larvae per cohort). ***P<0.001 refers to severely affected fish (gray bars) and was calculated by one-way ANOVA and Tukey’s post-hoc test. |
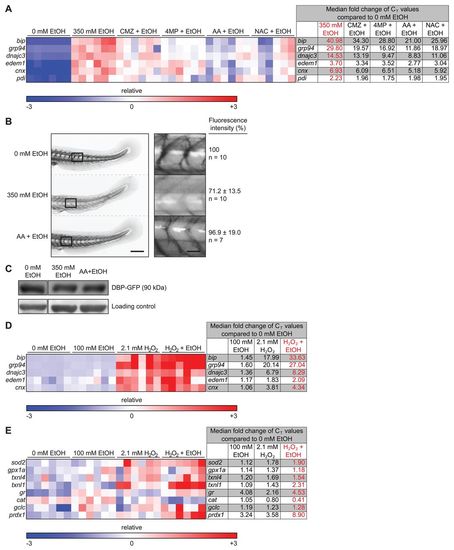
Ethanol metabolism and ROS are required for secretory pathway stress. (A) Heatmap of qPCR data from liver cDNA measuring the expression of genes involved in the UPR. The fold changes of the median CT values are in supplementary material Table S3. All six clutches are aligned according to the order of the lowest to the highest expression of bip in 350 mM ethanol treatment. (B) Representative images of the tail of Tg(l-fabp:Dbp-EGFP) 120 hpf larvae treated with 0 or 350 mM ethanol or co-treated with AA and 350 mM ethanol for 24 hours. The rectangles in the left panel are magnified in the right panel. Scale bars: 0.2 mm for the left panel and 0.04 mm for the right panel. Note that the curved tail in untreated larvae is an artifact of fixation. (C) Immunoblots of transgenic Tg(l-fabp:Dbp-EGFP) larvae treated as in B using anti-GFP antibody and a non-specific band serving as a loading control. (D,E) Low concentration of ethanol and H2O2 synergize to induce UPR (D) and oxidative stress (E). Heatmaps of qPCR data from the livers of larvae exposed to individual treatments of 100 mM ethanol or 2.1 mM H2O2, or a co-treatment of the two, for 24 hours. The individual CT values are in supplementary material Tables S4 and S5 for D and E, respectively. All six clutches are aligned according to the order of the lowest to the highest expression of bip (D) or sod2 (E) in the co-treatment of 350 mM ethanol and 2.1 mM H2O2. |
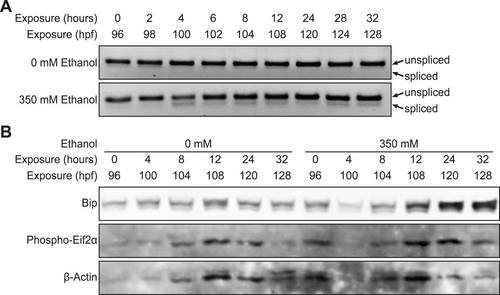
Ethanol induces UPR. (A) Livers dissected from larvae exposed to 0 or 350 mM ethanol at 96-128 hpf were subject to standard PCR with xbp1 primers, and the products were run in 4% agarose gel to achieve efficient separation of spliced and unspliced bands. The image is inverted. The spliced and unspliced bands were quantified, added to make 100%. Fold changes were calculated by normalizing the percentage of spliced bands of ethanoltreated samples to that of untreated samples and plotted in Figure 2B. (B) Immunoblot of Bip and phosphorylated Eif2α of livers dissected from larvae exposed to 0 or 350 mM ethanol at 96-128 hpf. For each time point, protein was extracted from exactly 20 livers. |

Homologs of ethanol metabolizing enzymes are expressed in zebrafish. (A) The protein sequence alignment of zebrafish (Danio rerio; Dr) Cyp2y3 and Cyp2p6 with that of human CYP2E1 (Hs) and mouse Cyp2e1 (Mm). Cyp2y3 and Cyp2p6 show 43% identity to human CYP2E1. The pink box highlights the substrate-binding site, which is also a part of the antibody-binding site. (B) Representative PCR agarose gels of adh5, adh8a, adh8b, cyp2y3, cyp2p6, aldh2 performed on cDNA prepared from a pool of dissected livers from control (–) and larvae treated with 350 mM ethanol (+) for 32 hours. rpp0 serves as a reference gene. (C-E) Immunoblots of proteins from 10-25 livers per sample using antibodies raised against human ADH1 and CYP2E1. VL-17A cells stably expressing mouse Adh1 and human CYP2E1 served as a positive control. |

Ethanol-induced HSC activation is partially rescued by CMZ assessed by laminin deposition. (A-D) show confocal single plane images of Tg(hand2:EGFP) expression in the HSCs of larvae treated under different conditions from 96 hpf to 120 hpf. The larvae were fixed immediately after the treatment at 120 hpf. Arrows point to individual HSCs. In control and CMZ-treated larvae, HSCs send out long and multiple cellular processes. Moreover, these HSCs are well segregated from one another. In ethanol (EtOH)-treated larvae, HSCs lose the complex processes, become elongated, and tend to cluster together. In larvae treated with both CMZ and ethanol, the HSC phenotypes seem to be partially suppressed as these cells form short and multiple cellular processes (arrows in D). (A′-D′) show the same images of (A-D), but with laminin staining. Ethanol treatment triggers laminin deposition (arrows in C′), whereas co-treatment with ethanol and CMZ suppresses laminin deposition. The blue staining in A′ and B′ is due to autofluorescence of the red blood cells. (A"-D") show three-dimensional projection of the confocal Z-stack that scanning through the whole livers in (A-D). In ethanoltreated liver, HSCs are clustered together, whereas in control, CMZ, and CMZ and ethanol cotreated liver, HSCs were well separated from one another. In (A-D") white dashed lines outline the periphery of the liver. Scale bar: 20 μm shown in (A). (E) Quantification of whole mount oil red O staining in 120 hpf larvae that were either untreated (N/T), or pre-treated with 3 mM CYA, 40 mM OAc at 94 hpf and then exposed to 0 or 350 mM ethanol at 96 hpf for 24 hours. Note that neither of these treatments affected the ethanol-induced steatosis. |