
- Title
-
The role of mislocalized phototransduction in photoreceptor cell death of retinitis pigmentosa
- Authors
- Nakao, T., Tsujikawa, M., Notomi, S., Ikeda, Y., and Nishida, K.
- Source
- Full text @ PLoS One
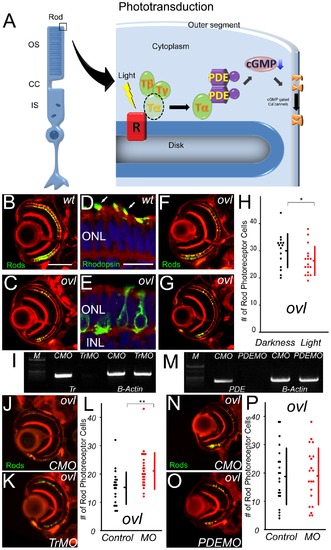
The pathway of photoreceptor cell death does not include PDE6β. (A) Schematic diagram of Phototransduction cascade. OS: outer segment, CC: connecting cilium, IS: inner segment, R: rhodopsin, T: transducin, PDE: phosphodiesterase (B and C) Eye ections of eyes from wt (B) and ovl (C) fish at 108 hpf. Rod photoreceptors are visualized with EGFP (Green). (Bar = 100 μm.) In ovl, the number of rod photoreceptors was decreased. (D and E) Transverse cryosections through wt (D) and ovl mutant (E) retinae at 4 dpf. F-actin is visualized with phalloidin (red), rod opsin with antibodies (green) and nuclei with Hoechst33342 (blue). Rhodopsin is mis-localized in ovl. Arrows indicate outer segments. (Bar = 10 μm.) ONL: outer nuclear layer, INL: inner nuclear layer (F and G)Ovl animals were reared in constant darkness (F) or in constant light (G) at 108 hpf. Light exposure reduces the survival of rod photoreceptor cells. (H) Graph of the number of rod photoreceptors in ovl fish at 108 hpf. (Bars mean SD, * means p<0.05.) (I) Trandsucin α expression analysis by RT-PCR of control morpholino- (lane1) and anti-Transducin α morpholino-treated (lane2). The expression of transducin is effectively suppressed by the morpholino at 108 hpf. CMO: control morpholino, TrMO: anti-Transducin α morpholino, (J and K) Sections of eyes treated by anti-transducin α morpholinos (K) and control MO (J) in ovl at 108 hpf. Anti-transducin a morpholinos rescued the rod photoreceptor cell death. (L) Rod photoreceptor numbers in anti-transducin α and control morpholino-treated ovl mutants at 108 hpf. (Bars mean SD, ** means p<0.01.) (M) PDE6β expression analysis by RT-PCR of control morpholino- (lane1) and anti-PDE6β (lane2) morpholino-treated mutants. The expression of PDE6β is effectively suppressed by the morpholino at 108 hpf. (N and O) Sections of eyes treated by anti-phosphodiesterase 6β morpholinos (O) and control MO (N) in ovl. (Bar = 100 μm.) There are no significant difference. (P) Rod photoreceptor survival in anti-phosphodiesterase 6β morpholino- (red dots) and control (black dots) morpholino-treated ovl mutants. Anti-PDE 6β morpholino has no significant effect on the number of rod photoreceptors. (Bars mean SD.) |
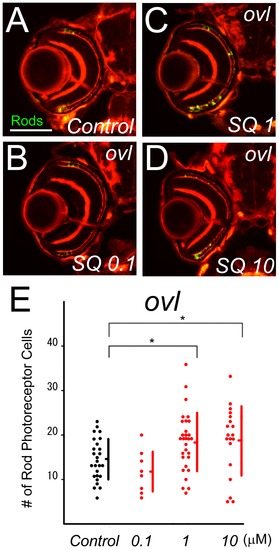
Inhibitor of ADCY suppresses photoreceptor cell death. (A–D) Sections of ovl mutants bred in SQ22536-treated water (B–D) and control water (A). (E) The number of surviving rod photoreceptors from ovl mutants in control water (black dots) and SQ22536-treated water. SQ22536 increased survival rod photoreceptors in concentrations of 1 and 10 mM. (Bars mean SD, * means p<0.05.) |
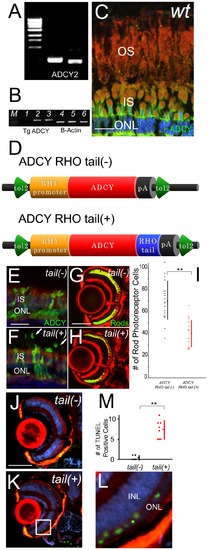
Mislocalized ADCY in rod outer segments induces photoreceptor cell death. (A) Expression analysis of adenylyl cyclases in wild-type retina by RT-PCR. (B) RT-PCR analysis of recombinant adenylyl cyclase 2B from wild-type (lane1), ADCY RHO tail (-) (lane2) and ADCY RHO tail (+) (lane3). Lanes 4 to 6 are B-actin expression of each group. Ectopic expressions were confirmed. (C) Immunohistochemistry (IHC) section of retina of wild-type. F-actin is visualized with phalloidin (red), ADCY2 with antibodies (green) and nuclei with Hoechst33342 (blue). OS: outer segment, IS: inner segment, ONL: outer nuclear layer (Bar = 10 μm.) ADCY did not expressed at OS. (D) Schematic diagrams of over-expression constructs. ADCY RHO tail (-) and (+) are downstream of zebrafish RH1 promoter between tol2 arms. (E and F) IHC sections of retina of ADCY RHO tail (-) fish (E) and ADCY RHO tail (+) fish (F) at 14 dpf. F-actin is visualized with phalloidin (red), ADCY2 with antibodies (green) and nuclei with Hoechst33342 (blue). Arrows indicate outer segments. IS: inner segment, ONL: outer nuclear layer (Bar = 10 μm.) ADCY is mis-localized at OS in only tail(+) animals. (G and H) Eye sections of ADCY RHO tail (-) and (+) animals at 14 dpf. Rod photoreceptors are visualized with EGFP (green) and F-actin with phalloidin (red). (Bar = 100 μm.) The number of rod photoreceptors was significantly decreased in tail (+) animals. (I) Graph of the number of rod photoreceptor of ADCY RHO tail (-) (black dots) and (+) (red dots). (Bars mean SD, ** means p<0.01.) (J and K) TUNEL (green) assay of sections in ADCY RHO tail (-) (J) and (+) (K) animals. F-actin is visualized with phalloidin (red), and nuclei with DAPI (blue). The signals of outer nuclear layer were observed only in tail (+) animals. (L) Magnification of the white square in (K). INL: inner uclear layer, ONL: outer nuclear layer. (M) Graph of the number of TUNEL assay positive cells, comparing ADCY RHO tail (-) (black dots) and (+) (red dots) animals. (Bars mean SD, ** means p<0.01.) |
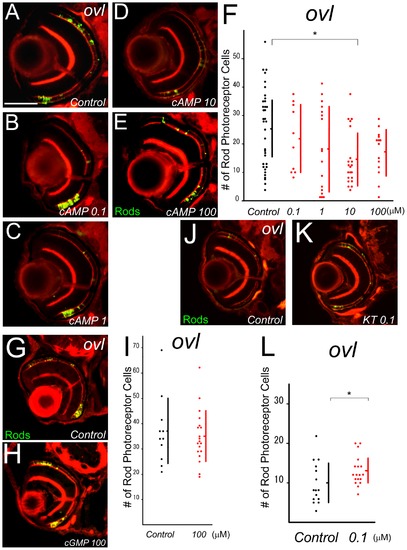
Treatment with cAMP analogue, cGMP analogue, and KT5720 in ovl. (A–E) Eye sections at 5 dpf ovl treated with different concentration of a cAMP analogue, 8-Bromo-cAMP. 8-Bromo-cAMP (B–E) or control water (A). Rod photoreceptors are visualized by EGFP (green) and F-actin by phalloidin (red). (Bar = 100 μm.) (F) Graph of survival rod photoreceptors of ovl mutants in control water (black dots) and cAMP analogue-treated water. cAMP analogue accelerated rod photoreceptor death. (Bars mean SD, * means p<0.05.) (G and H) Eye sections at 5 dpf ovl treated with an cGMP analogue, 8-Bromo-cGMP. (H) or control water (G). Rod photoreceptors are visualized with EGFP (green) and F-actin with phalloidin (red). (I) Graph of survival of ovl mutant rod photoreceptors in control water (black dots) and cGMP analogue-treated water. cGMP does not accelerate rod photoreceptor death. (Bars mean SD.) (J and K) Eye sections at 5 dpf ovl treated with KT5720 (K) or control water (J). Rod photoreceptors are visualized by EGFP (green) and F-actin by phalloidin (red). (L) Graph of survival of ovl mutant rod photoreceptors in control water (black dots) and KT5720 analogue-treated water. KT5720 suppresses rod photoreceptor death. (Bars mean SD, * means p<0.05.) |

Rod photoreceptor cell death in rhodopsin Q344X transgenic fish. (A) RT-PCR analysis of expression of ectopic rhodopsin Q344X transgene. (B) Sequence analysis of transgene in Q344X animal at 5 dpf. (C–H) Sections of normal rhodopsin fish at 3 dpf (C), 5 dpf (E), 7 dpf (G) and rhodopsin Q344X transgenic fish at 3 dpf (D), 5 dpf (F), 7 dpf (H). Rod photoreceptors are visualized with EGFP (green) and F-actin with phalloidin (red). (Bar = 100 μm.) (I) Graph of the number of rod photoreceptor of normal rhodopsin and rhodopsin Q344X mutant at 3, 5 and 7 dpf. (Bars mean SD, * means p<0.05, ** means p<0.01.) Rod photoreceptors decreased by 5 dpf. (J and K) Immunohistochemistry sections of retina of wild-type (J) and Q344X (K) animal. F-actin is visualized with phalloidin (red), rod opsin with antibodies (green) and nuclei with Hoechst33342 (blue). OS: outer segment, IS: inner segment, ONL: outer nuclear layer (Bar = 10 µm.) Cell localization of rhodopsin is abnormal in Q344X. (L and M) TUNEL (green) assay of sections of normal rhodopsin (L) and rhodopsin Q344X transgenic (M) animals. F-actin is visualized with phalloidin (red), and nuclei with DAPI (blue). Arrows indicate TUNEL positive photoreceptor cells. TUNEL staining in ONL was observed only in Q344X. (N) Graph of the number of TUNEL assay positive cells, comparing normal rhodopsin (black dots) and rhodopsin Q344X (red dots) transgenic animals. (Bars mean SD, * means p<0.05.) EXPRESSION / LABELING:
PHENOTYPE:
|

Effects on photoreceptor cell death in Q344X fish. (A and B) Retina sections of eyes from rhodopsin Q344X transgenic at 5 dpf. Animals were reared in constant darkness (A) or in constant light (B). Light exposure reduces the survival of rod photoreceptor cells. Rod photoreceptors are visualized by EGFP (Bar = 100 μm.) Light accelerated the rod cell death. (C) Graph of the number of rod photoreceptors in rhodopsin Q344X transgenic fish at 5 dpf. Darkness and light exposure are compared. (Bars mean SD, ** means p<0.01.) (D and E) Eye sections of eyes treated by anti-transducin morpholinos (E) and control MO (D) in Q344X at 5 dpf. Suppression of transducin α expression enhances the survival of rod photoreceptor cells. Rod photoreceptors are visualized by EGFP (Bar = 100 μm.). (F) Graph of the number of rods in Q344X, control morpholino-treated and anti-transducin morpholinos. (Bars mean SD, * means p<0.05.) (G and H) Eye sections of eyes treated by anti-phosphodiesterase 6β morpholinos (H) and control MO (G) in Q344X at 5 dpf. Suppression of phosphodiesterase expression reduces the survival of rod photoreceptor cells. Rod photoreceptors are visualized with EGFP (Bar = 100 μm.). (I) Graph of the number of rods in Q344X, control morpholino-treated and anti-phosphodiesterase 6β morpholinos. (Bars mean SD, ** means p<0.01.) (J and K) Eye ections of Q344X transgenic fish bred in SQ22536-treated water (K) and normal control water (J) at 5 dpf. Rod photoreceptors are visualized by EGFP (Bar = 100 μm.) ADCY antagonist rescued rod photoreceptor cell death. (L) Graph of the number of rod photoreceptor cells in Q344X 5 dpf. Black dots indicate control and red dots indicate SQ22536-treated (10, 20 and 100 mM) water. (Bars mean SD, * means p<0.05.) |

Rod photoreceptor cell death in ovl. (A–F) Sections of wild type fish at 3 (A), 5 (C) 7 dpf (E) and ovl at 3(B), 5(D) 7 dpf (F). Rod photoreceptors were visualized with EGFP (green) and F-actin with phalloidin (red). (Bar = 100 μm.) (G) The number of rod photoreceptor of wild type fish and ovl during development (Bars mean SD, ** means p<0.01.). |
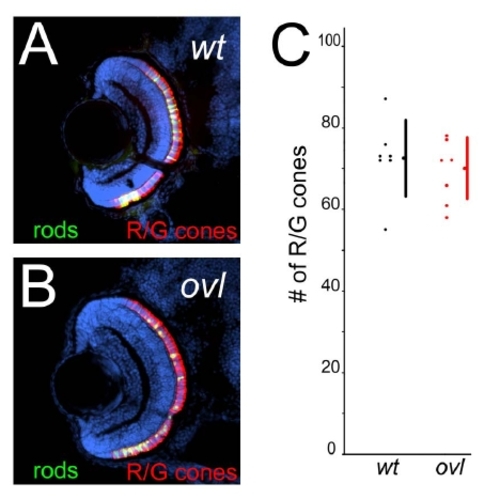
Cones are not decreased in ovl at 4 dpf. (A and B) Sections of eyes from wt (A) and ovl (B) fish at 108 hpf. R/G cone photoreceptors were visualized with zpr1 (red), rod photoreceptors are visualized with EGFP (green) and nuclei with Hoechst33342 (blue). (Bar = 100 μm.) There were no significant changes. (C) The number of R/G cone photoreceptors in wt (black dots) and ovl fish (red dots) at 4 dpf. wild type, average = 72.6; ovl, average = 69.1; p = 0.235. Bars mean SD. |
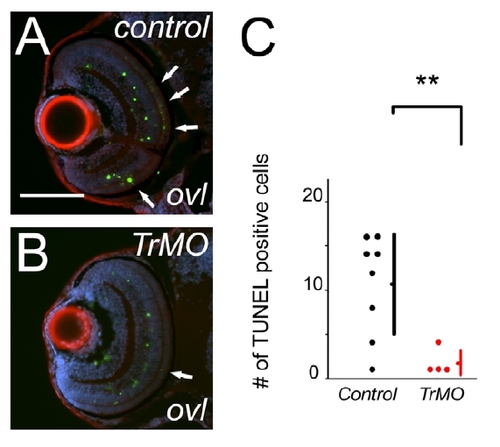
Transducin morpholino suppresses photoreceptor apoptosis in ovl. (A and B) TUNEL (green) assay of sections of control (A) and transducin morpholino treated (B) in ovl. F-actin is visualized with phalloidin (red), and nuclei with DAPI (blue). Arrow heads indicate TUNEL positive cells in outer-nuclear layer in control animals. (N) The number of TUNEL assay positive cells in outer-nuclear layer, comparing control (black dots) and transducin morpholino treated (red dots) in ovl. control group, average = 10.6; transducin α morpholino treated group, average = 1.8; p = 0.00136. Bars mean SD, ** means p<0.01.). |
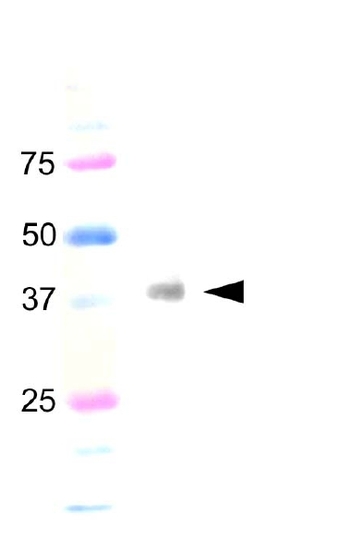
Western blotting of the ovl fish with ADCY 2 antibody. Arrow head indicate specific expected band (38.2 kDa). |
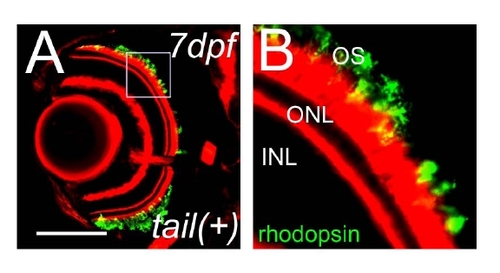
Transport of rhodopsin is not significantly affected in ADCY RHO tail (+) fish. (A) Rhodopsin staining on the sections of retina of ADCY RHO tail (+) fish. (B) Magnification of white square in (A). Rhodopsin was normally transported to outer segments. F-actin is visualized with phalloidin (red) and rhodopsin with antibodies (green). (Bar = 100 μm.) |
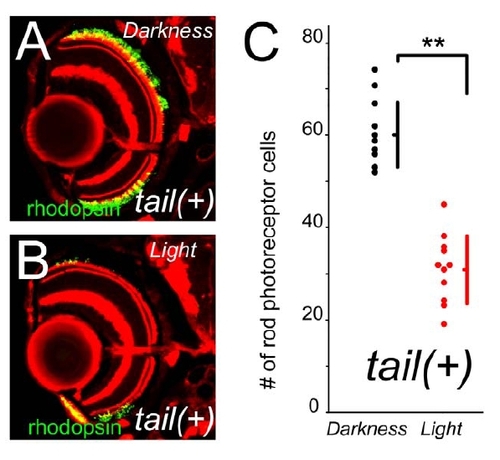
Rod photoreceptor cell death in ADCY RHO tail (+) is light dependent. (A and B) Animals were reared in constant darkness (A) or in constant light (B). Light exposure reduces the survival of rod photoreceptor cells. Rhodopsin is visualized by antibody (green) and F-actin by phalloidin (red). (Bar = 100 μm.) (C) The number of survived rod photoreceptors in ADCY RHO tail (+) fish under constant darkness (black dots) and under constant light (red dots). (Bars mean SD, * means p<0.05.) |

Cones are not decreased in ADCY RHO tail (+) fish. (A and B) Sections of eyes from wt (A) and ADCY RHO tail (+) fish (B) at 7 dpf. R/G cone photoreceptors were visualized with zpr1 (green) and F-actin by phalloidin (red). (Bar = 100 μm) No significant difference was observed under the normal light condition. (C) The number of R/G cone photoreceptors in wt (black dots) and ADCY RHO tail (+) fish (red dots) at 7 dpf. (Bars mean SD.) |
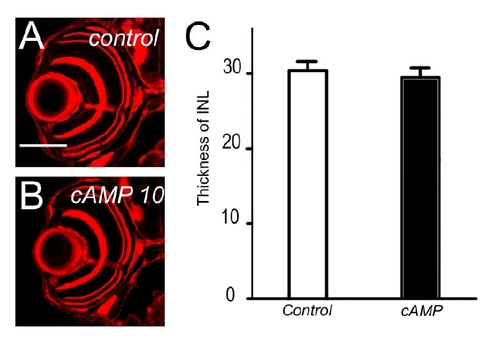
Inner nuclear layer is not affected by 8-Bromo-cAMP treatment. (A and B) Eye sections at 5 dpf ovl treated with 10 μM of a cAMP analogue, 8-Bromo-cAMP (B) and control (A). There are no significant differences. (C) The thickness of inner nuclear layer was not affected by 8-Bromo-cAMP treatment. |
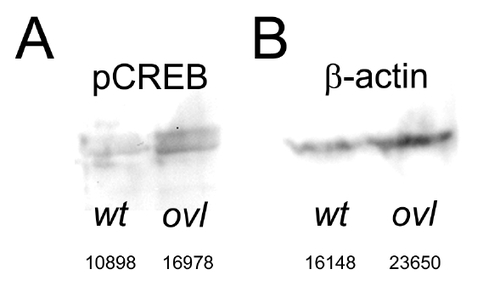
Western blotting of wild type and the ovl fish with pCREB antibody. Western blot of phosphorylated CREB (A) and β-actin (B) in ovl eye. Anti-CREB antibodies did not work in zebrafish, so we used β-actin as a control. The numbers below the blot is the raw densitometry data. pCREB is increased 6.37% under the normalization by β-actin. |
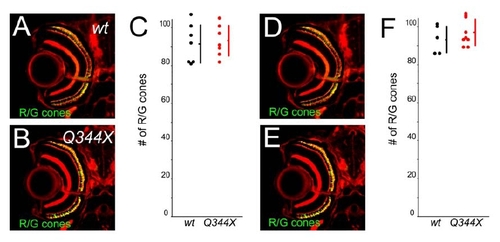
Cones are not decreased in rhodopsin Q344X transgenic fish. (A and B) Sections of eyes from wt (A) and Q344X transgenic fish (B) at 5 dpf. R/G cone photoreceptors were visualized with zpr1 (green) and F-actin by phalloidin (red). (Bar = 100 μm.) There were no significant changes. (C) The number of R/G cone photoreceptors in wt (black dots) and Q344X transgenic fish (red dots) at 5 dpf. (Bars mean SD.) (D and E) Sections of eyes from wt (D) and Q344X transgenic fish (E) at 7 dpf. R/G cone photoreceptors were visualized with zpr1 (green) and F-actin by phalloidin (red). (C) The number of R/G cone photoreceptors in wt (black dots) and Q344X transgenic fish (red dots) at 7 dpf. (Bars mean SD.) |
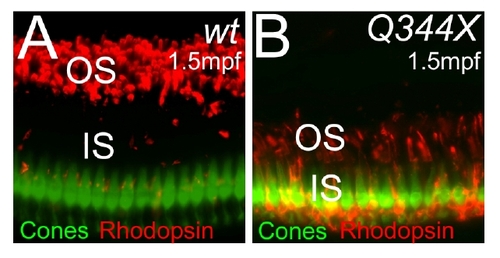
Cones do not significantly degenerate in rhodopsin Q344X transgenic fish at 1.5 mpf. (A and B) Sections of eyes from wt (A) and Q344X transgenic fish (B) at 1.5 mpf. UV cone photoreceptors were visualized with EGFP (green) and rhodopsin by antibody (red). OS: outer segment, IS: inner segment. |