
Image
|
Figure Caption
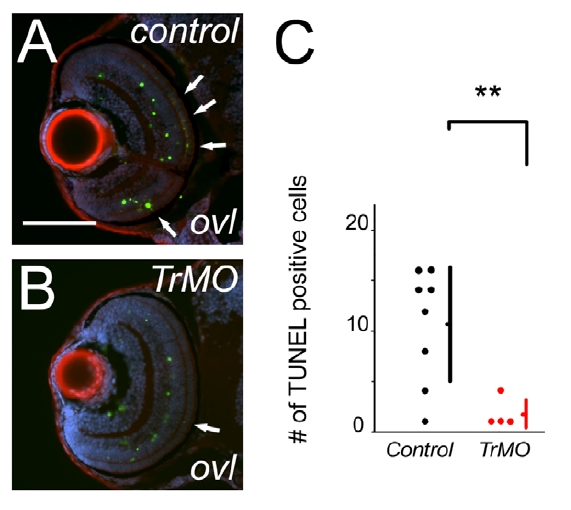
Fig. S3
Transducin morpholino suppresses photoreceptor apoptosis in ovl. (A and B) TUNEL (green) assay of sections of control (A) and transducin morpholino treated (B) in ovl. F-actin is visualized with phalloidin (red), and nuclei with DAPI (blue). Arrow heads indicate TUNEL positive cells in outer-nuclear layer in control animals. (N) The number of TUNEL assay positive cells in outer-nuclear layer, comparing control (black dots) and transducin morpholino treated (red dots) in ovl. control group, average = 10.6; transducin α morpholino treated group, average = 1.8; p = 0.00136. Bars mean SD, ** means p<0.01.).
Acknowledgments
This image is the copyrighted work of the attributed author or publisher, and
ZFIN has permission only to display this image to its users.
Additional permissions should be obtained from the applicable author or publisher of the image.
Full text @ PLoS One