
|
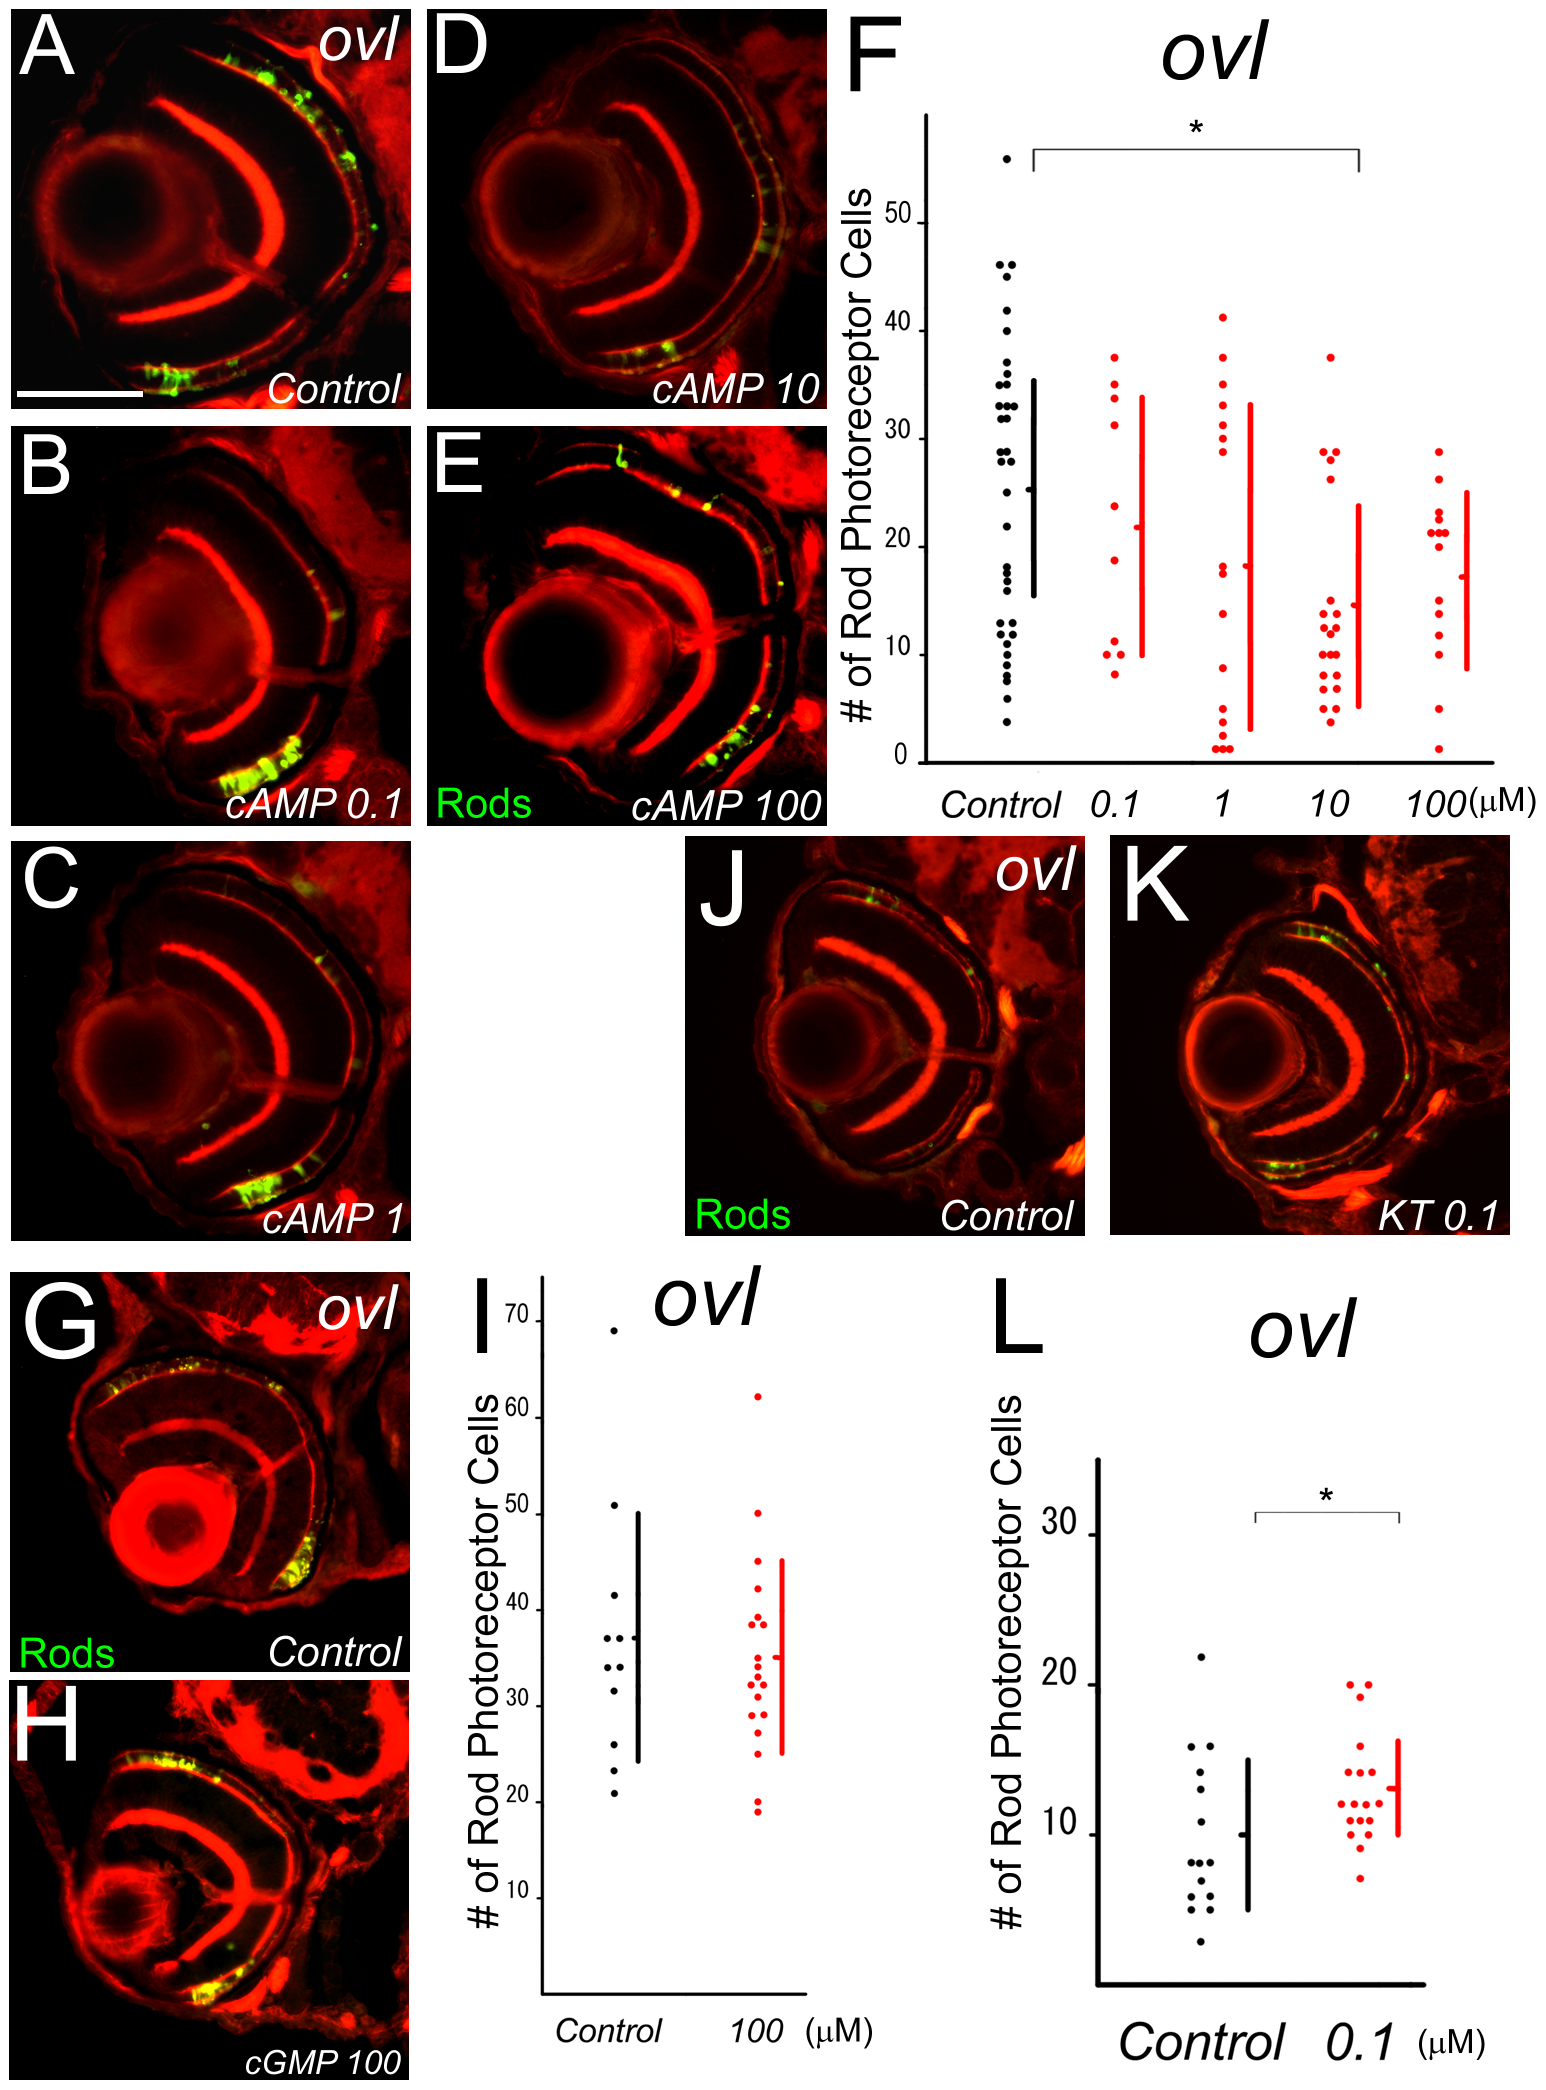
Fig. 4
Treatment with cAMP analogue, cGMP analogue, and KT5720 in ovl.
(A–E) Eye sections at 5 dpf ovl treated with different concentration of a cAMP analogue, 8-Bromo-cAMP. 8-Bromo-cAMP (B–E) or control water (A). Rod photoreceptors are visualized by EGFP (green) and F-actin by phalloidin (red). (Bar = 100 μm.) (F) Graph of survival rod photoreceptors of ovl mutants in control water (black dots) and cAMP analogue-treated water. cAMP analogue accelerated rod photoreceptor death. (Bars mean SD, * means p<0.05.) (G and H) Eye sections at 5 dpf ovl treated with an cGMP analogue, 8-Bromo-cGMP. (H) or control water (G). Rod photoreceptors are visualized with EGFP (green) and F-actin with phalloidin (red). (I) Graph of survival of ovl mutant rod photoreceptors in control water (black dots) and cGMP analogue-treated water. cGMP does not accelerate rod photoreceptor death. (Bars mean SD.) (J and K) Eye sections at 5 dpf ovl treated with KT5720 (K) or control water (J). Rod photoreceptors are visualized by EGFP (green) and F-actin by phalloidin (red). (L) Graph of survival of ovl mutant rod photoreceptors in control water (black dots) and KT5720 analogue-treated water. KT5720 suppresses rod photoreceptor death. (Bars mean SD, * means p<0.05.)