
Image
|
Figure Caption
Fig. S1
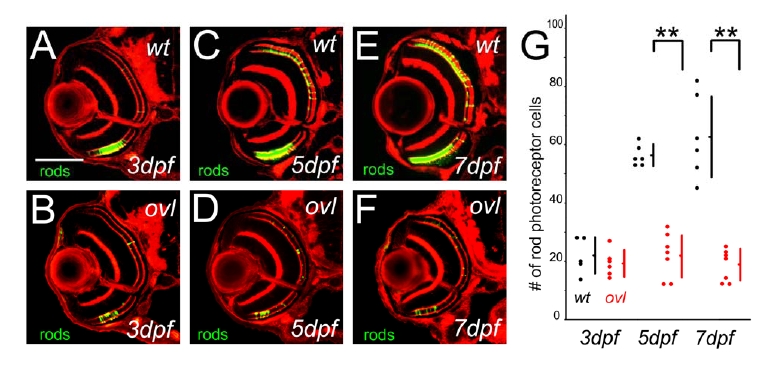
Rod photoreceptor cell death in ovl. (A–F) Sections of wild type fish at 3 (A), 5 (C) 7 dpf (E) and ovl at 3(B), 5(D) 7 dpf (F). Rod photoreceptors were visualized with EGFP (green) and F-actin with phalloidin (red). (Bar = 100 μm.) (G) The number of rod photoreceptor of wild type fish and ovl during development (Bars mean SD, ** means p<0.01.).
Acknowledgments
This image is the copyrighted work of the attributed author or publisher, and
ZFIN has permission only to display this image to its users.
Additional permissions should be obtained from the applicable author or publisher of the image.
Full text @ PLoS One