
Fig. 3
- ID
- ZDB-FIG-120412-3
- Publication
- Nakao et al., 2012 - The role of mislocalized phototransduction in photoreceptor cell death of retinitis pigmentosa
- Other Figures
- All Figure Page
- Back to All Figure Page
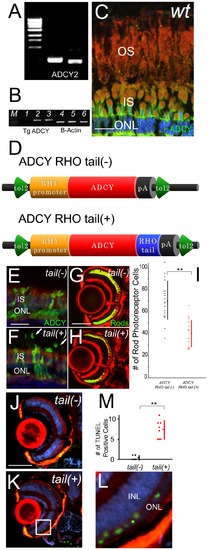
Mislocalized ADCY in rod outer segments induces photoreceptor cell death. (A) Expression analysis of adenylyl cyclases in wild-type retina by RT-PCR. (B) RT-PCR analysis of recombinant adenylyl cyclase 2B from wild-type (lane1), ADCY RHO tail (-) (lane2) and ADCY RHO tail (+) (lane3). Lanes 4 to 6 are B-actin expression of each group. Ectopic expressions were confirmed. (C) Immunohistochemistry (IHC) section of retina of wild-type. F-actin is visualized with phalloidin (red), ADCY2 with antibodies (green) and nuclei with Hoechst33342 (blue). OS: outer segment, IS: inner segment, ONL: outer nuclear layer (Bar = 10 μm.) ADCY did not expressed at OS. (D) Schematic diagrams of over-expression constructs. ADCY RHO tail (-) and (+) are downstream of zebrafish RH1 promoter between tol2 arms. (E and F) IHC sections of retina of ADCY RHO tail (-) fish (E) and ADCY RHO tail (+) fish (F) at 14 dpf. F-actin is visualized with phalloidin (red), ADCY2 with antibodies (green) and nuclei with Hoechst33342 (blue). Arrows indicate outer segments. IS: inner segment, ONL: outer nuclear layer (Bar = 10 μm.) ADCY is mis-localized at OS in only tail(+) animals. (G and H) Eye sections of ADCY RHO tail (-) and (+) animals at 14 dpf. Rod photoreceptors are visualized with EGFP (green) and F-actin with phalloidin (red). (Bar = 100 μm.) The number of rod photoreceptors was significantly decreased in tail (+) animals. (I) Graph of the number of rod photoreceptor of ADCY RHO tail (-) (black dots) and (+) (red dots). (Bars mean SD, ** means p<0.01.) (J and K) TUNEL (green) assay of sections in ADCY RHO tail (-) (J) and (+) (K) animals. F-actin is visualized with phalloidin (red), and nuclei with DAPI (blue). The signals of outer nuclear layer were observed only in tail (+) animals. (L) Magnification of the white square in (K). INL: inner uclear layer, ONL: outer nuclear layer. (M) Graph of the number of TUNEL assay positive cells, comparing ADCY RHO tail (-) (black dots) and (+) (red dots) animals. (Bars mean SD, ** means p<0.01.) |
| Gene: | |
|---|---|
| Fish: | |
| Anatomical Term: | |
| Stage: | Day 4 |
| Fish: | |
|---|---|
| Observed In: | |
| Stage: | Day 4 |