
- Title
-
The Cell Adhesion-associated Protein Git2 Regulates Morphogenetic Movements during Zebrafish Embryonic Development
- Authors
- Yu, J.A., Foley, F.C., Amack, J.D., and Turner, C.E.
- Source
- Full text @ Dev. Biol.

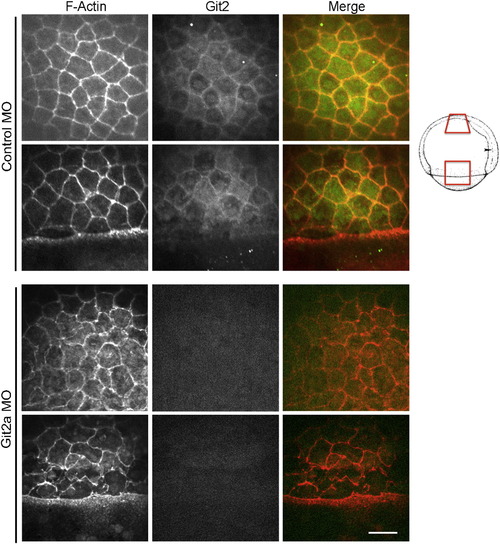
Identification and characterization of git2 genes in zebrafish. (A) Phylogenetic analysis of zebrafish git2 family genes. Dendogram of zebrafish git2a on chromosome 5 and git2b on chromosome 10 and related orthologs from other species. (B) In situ hybridization of git2a mRNA expression in the zebrafish embryo. git2a expression was ubiquitously detected at the 4-cell, epiboly, tailbud and 14-somite (14SS) and 24 hpf stages. (C) Western blotting of zebrafish Git2 protein at dome, 50%, 75%, 90% epiboly and 6-somite (6SS) stages, α-tubulin and paxillin were used as loading controls. (D) Immunohistochemistry of Git2 (red) at the 75% epiboly stage. Embryos were co-stained with phalloidin to detect F-actin (green). Images show surface EVL cells and deep cells (30 μm below the surface). Scale bar, 50 μm. Fluorescent intensity profiles show relative F-actin (green) and Git2 (red) levels in EVL cells at the blastoderm margin (1) and deep cells (2). (E) Immunohistochemistry of Git2 (red) at the 24 hpf. Embryos were co-stained with phalloidin to detect F-actin (green). Scale bar, 50 μm. Zebrafish embryo drawings are adapted from Kimmel et al., 1995. |

Embryonic phenotypes following Git2a morpholino knockdown. (A) Live embryos injected with either control morpholino (MO) or git2a MO at 24 hpf and 48 hpf. git2a morphants exhibited variable defects including a curled tail, a short body axis and edema. The graph shows the quantification of phenotypes at 24 hpf from three independent experiments. (B) Representative images of control and git2a morphant embryos at 6, 10 and 12 hpf. A delay or arrest of epiboly was observed in git2a morphants. (C) The percentage of control and git2a MO embryos showing epiboly defects. Co-injection of chicken GIT2 mRNA partially rescued these defects. Injection of git2a MO into the yolk cell resulted in only minor epiboly defects. (D) Timing of epiboly progression in uninjected, control MO, git2a MO injected and chicken GIT2 mRNA rescued embryos. Data combined from at least four independent experiments. (E) Representative images of chicken GIT2 mRNA rescue phenotypes compared with control and git2a morphants at 9 and 24 hpf. (F) Western blot for Git2 protein expression in git2a morphants and embryos co-injected with git2a MO and chicken GIT2 mRNA. |
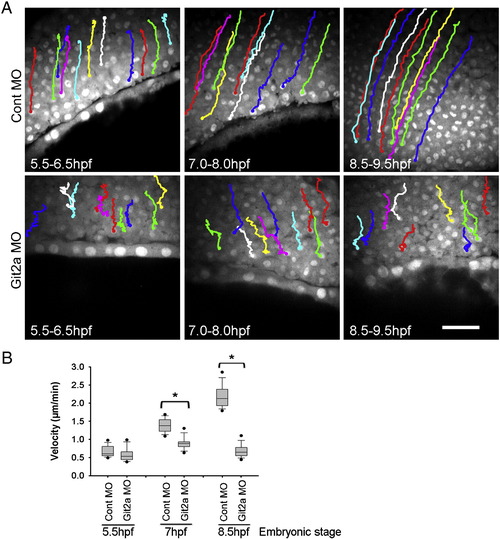
Epiboly cell migration is impaired by Git2a knockdown. (A) Cell tracking images generated from the time-lapse movies of control and Git2a morphants during epiboly. Representative migration paths of deep (epiblast) cells were obtained by tracking cell nuclei at 5.5-6.5 hpf, 7-8 hpf, 8.5-9.5 hpf. Scale bar, 50 µm. (B) Quantification of deep cell migration velocity of control and git2a morphant embryos by Box and Whisker Plot diagrams. For each set, forty cells from three embryos were tracked and measured by ImageJ software. Student′s t-test, *p < 0.005. PHENOTYPE:
|
Cell morphology is disrupted by Git2a knockdown. Representative images of cortical actin (red) and Git2 (green) distribution in EVL cells of control and git2a morphant embryos at 75% epiboly. Git2 expression was reduced and cell morphology, outlined by cortical actin, was significantly altered in git2a morphants. Scale bar, 50 μm. Animal pole region (upper row) and lateral region (lower row) demonstrated in control and Git2a morphant embryo are schematically represented on the right (Kimmel et al., 1995). EXPRESSION / LABELING:
PHENOTYPE:
|
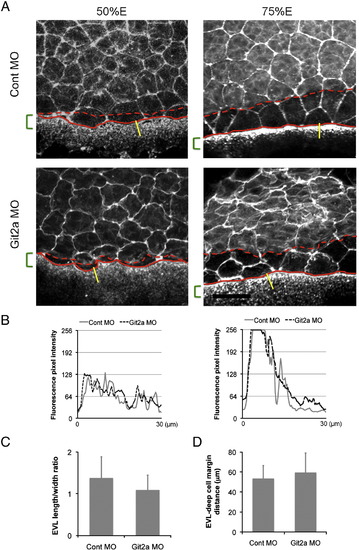
Analysis of EVL, deep cell and YSL actin structures in git2a morphants. (A) Representative images of phalloidin staining of actin in EVL cells, deep cells and the YSL of control and git2a morphant embryos at 50% and 75% epiboly. The red lines indicate the margins of the deep cell layer (dashed line) and the EVL layer (solid line). The green brackets show the width of the actin band in the YSL at the margin. Scale bar, 50 μm. (B) Phalloidin fluorescence pixel intensity profiles of the actin gradient in the YSL band in control (grey solid line) and git2a morphants (black dash line) at 50% (left) and 75% (right) epiboly. (C) The length/width ratio (LWR) of EVL cells at the margin in 75% epiboly control and git2a morphant embryos. The mean and standard deviation are calculated from 64 cells in 12 embryos from four independent experiments. (D) The mean distance between the EVL margin (solid red line in A) and deep cell margin (dashed red line in A) at 75% epiboly in control and git2a morphants. The mean and standard deviation is calculated from 10 embryos from four independent experiments. |
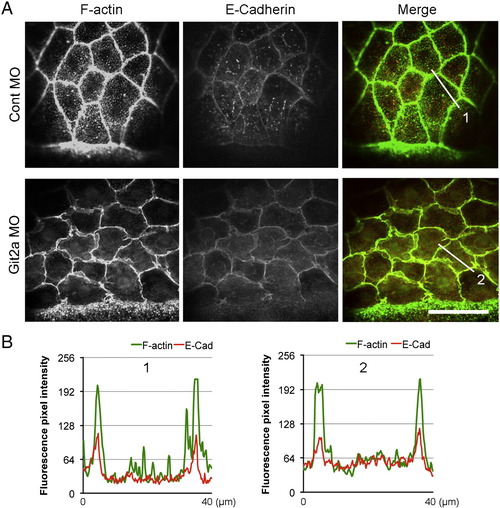
E-Cadherin localizes to adherens junctions in git2a morphants. (A) Representative immunofluoresence images of cortical actin (green) and E-Cadherin (red) in EVL cells of control and git2a morphant embryos. Scale bar, 50 μm. (B) F-actin and E-Cadherin fluorescence pixel intensity profiles of control (1) and Git2a morphant (2) embryos. PHENOTYPE:
|
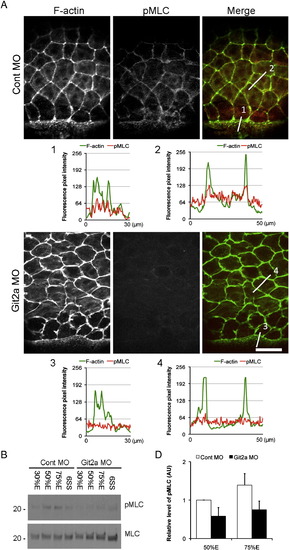
Git2 functions through myosin II-dependent contractility to regulate epiboly. (A) Immunofluoresence staining of phosphorylated Myosin light chain (pMLC) and F-actin in EVL cells of control and git2a morphants at 75% epiboly. In control embryos, pMLC (red) co-localized with cortical actin (green) at the cell periphery in EVL cells and at the margin where the EVL contacts the YSL. However, a significant reduction of pMLC staining was observed in git2a morphants. Scale bar, 50 μm. The F-actin and pMLC fluorescence pixel intensity profiles of EVL cells in control (1, 2) and git2a morphant (3, 4) embryos was aligned. (B) Western blotting of pMLC and total levels of MLC in control and git2a morphants from 30% epiboly to the 6 somite stage. (C) Quantification of the relative level of pMLC: total MLC from control and git2a morphants at 50% and 75% epiboly from three independent experiments. An arbitrary unit (AU) is designated as the pMLC level at 50% epiboly. EXPRESSION / LABELING:
|
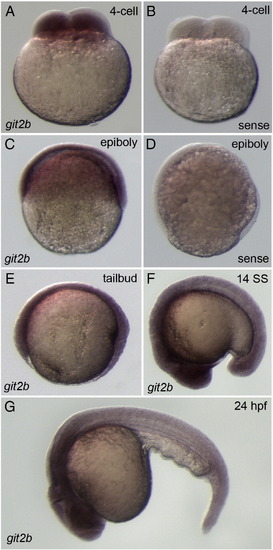
mRNA expression of git2b in the early zebrafish embryo. Whole-mount in situ hybridization using git2b antisense probes detected ubiquitous git2b expression at the 4-cell (A), epiboly (C), tailbud (E), 14-somite (14SS, F) stages and at 24 hpf (G). Control git2b sense probes showed greatly reduced or absent staining (B, D). |

Embryonic phenotypes of Git2a knockdown. (A) Montage of images from a representative time-lapse movie showing git2a morphant phenotypes at 6 hpf, 8 hpf, 10 hpf and 12 hpf. Constriction (white arrow) and cell movement delay or arrest (white arrowhead) was detected during epiboly in git2a morphants, which often resulted in embryonic lethality. (B) Quantification of epiboly defects in embryos examined at 9 hpf shows that the affect of git2a MO was dose-dependent. Data pooled from three independent experiments (n e 316 for each dose). (C) Western blotting of Git2 showing dose-dependent MO knockdown of Git2 protein. |

Whole-mount in situ hybridization of the mesodermal marker no tail (ntl) in git2a morphants. Lateral (A) and dorsal (B) views of embryos showing expression of the mesodermal marker no tail (ntl) in control and git2a morphant embryos at comparable stages of epiboly. |
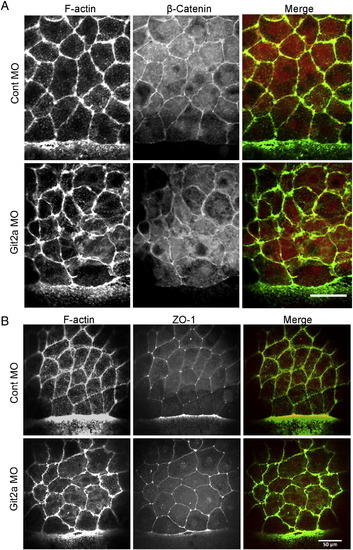
β-Catenin and ZO-1 localize to cell junctions in git2a morphants. (A) Representative immunofluoresence images of the adherens junction marker β-Catenin (red) and cortical actin (green) in EVL cells of control and git2a morphant embryos. Scale bar, 50 μm. (B) Representative immunofluoresence images of the tight junction marker ZO-1 (red) and cortical actin (green) in EVL cells of control and git2a morphant embryos. Scale bar, 50 μm. |
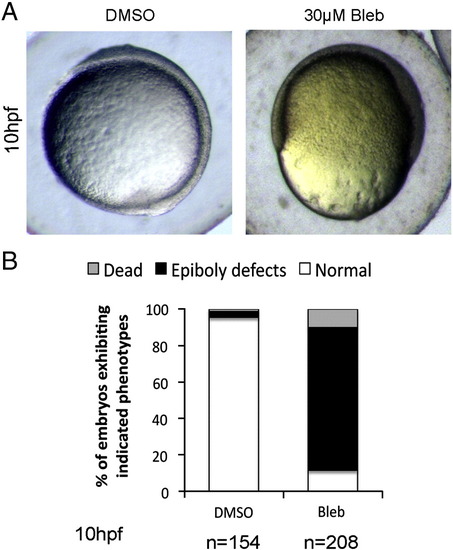
Blebbistatin treatment mimics epiboly defects observed in git2a morphants. (A) Representative images of DMSO and Blebbistatin (30 μM) treated embryos captured at 10 hpf. Epiboly defects similar to those observed in git2a morphants were seen in Blebbistatin treated embryos. (B) Quantification of the epiboly defect phenotype from three independent experiments. |

Unillustrated author statements PHENOTYPE:
|
Reprinted from Developmental Biology, 349(2), Yu, J.A., Foley, F.C., Amack, J.D., and Turner, C.E., The Cell Adhesion-associated Protein Git2 Regulates Morphogenetic Movements during Zebrafish Embryonic Development, 225-237, Copyright (2011) with permission from Elsevier. Full text @ Dev. Biol.