
Fig. 5
- ID
- ZDB-FIG-110121-33
- Publication
- Yu et al., 2011 - The Cell Adhesion-associated Protein Git2 Regulates Morphogenetic Movements during Zebrafish Embryonic Development
- Other Figures
- All Figure Page
- Back to All Figure Page
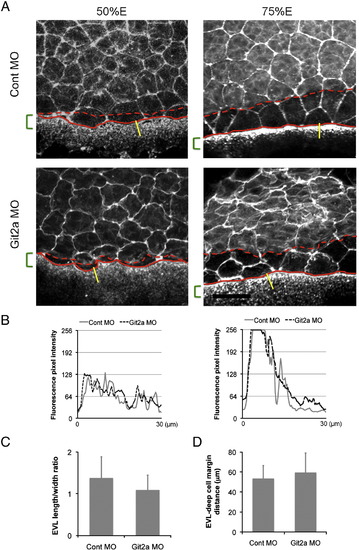
Analysis of EVL, deep cell and YSL actin structures in git2a morphants. (A) Representative images of phalloidin staining of actin in EVL cells, deep cells and the YSL of control and git2a morphant embryos at 50% and 75% epiboly. The red lines indicate the margins of the deep cell layer (dashed line) and the EVL layer (solid line). The green brackets show the width of the actin band in the YSL at the margin. Scale bar, 50 μm. (B) Phalloidin fluorescence pixel intensity profiles of the actin gradient in the YSL band in control (grey solid line) and git2a morphants (black dash line) at 50% (left) and 75% (right) epiboly. (C) The length/width ratio (LWR) of EVL cells at the margin in 75% epiboly control and git2a morphant embryos. The mean and standard deviation are calculated from 64 cells in 12 embryos from four independent experiments. (D) The mean distance between the EVL margin (solid red line in A) and deep cell margin (dashed red line in A) at 75% epiboly in control and git2a morphants. The mean and standard deviation is calculated from 10 embryos from four independent experiments. |
Reprinted from Developmental Biology, 349(2), Yu, J.A., Foley, F.C., Amack, J.D., and Turner, C.E., The Cell Adhesion-associated Protein Git2 Regulates Morphogenetic Movements during Zebrafish Embryonic Development, 225-237, Copyright (2011) with permission from Elsevier. Full text @ Dev. Biol.