
Image
|
Figure Caption
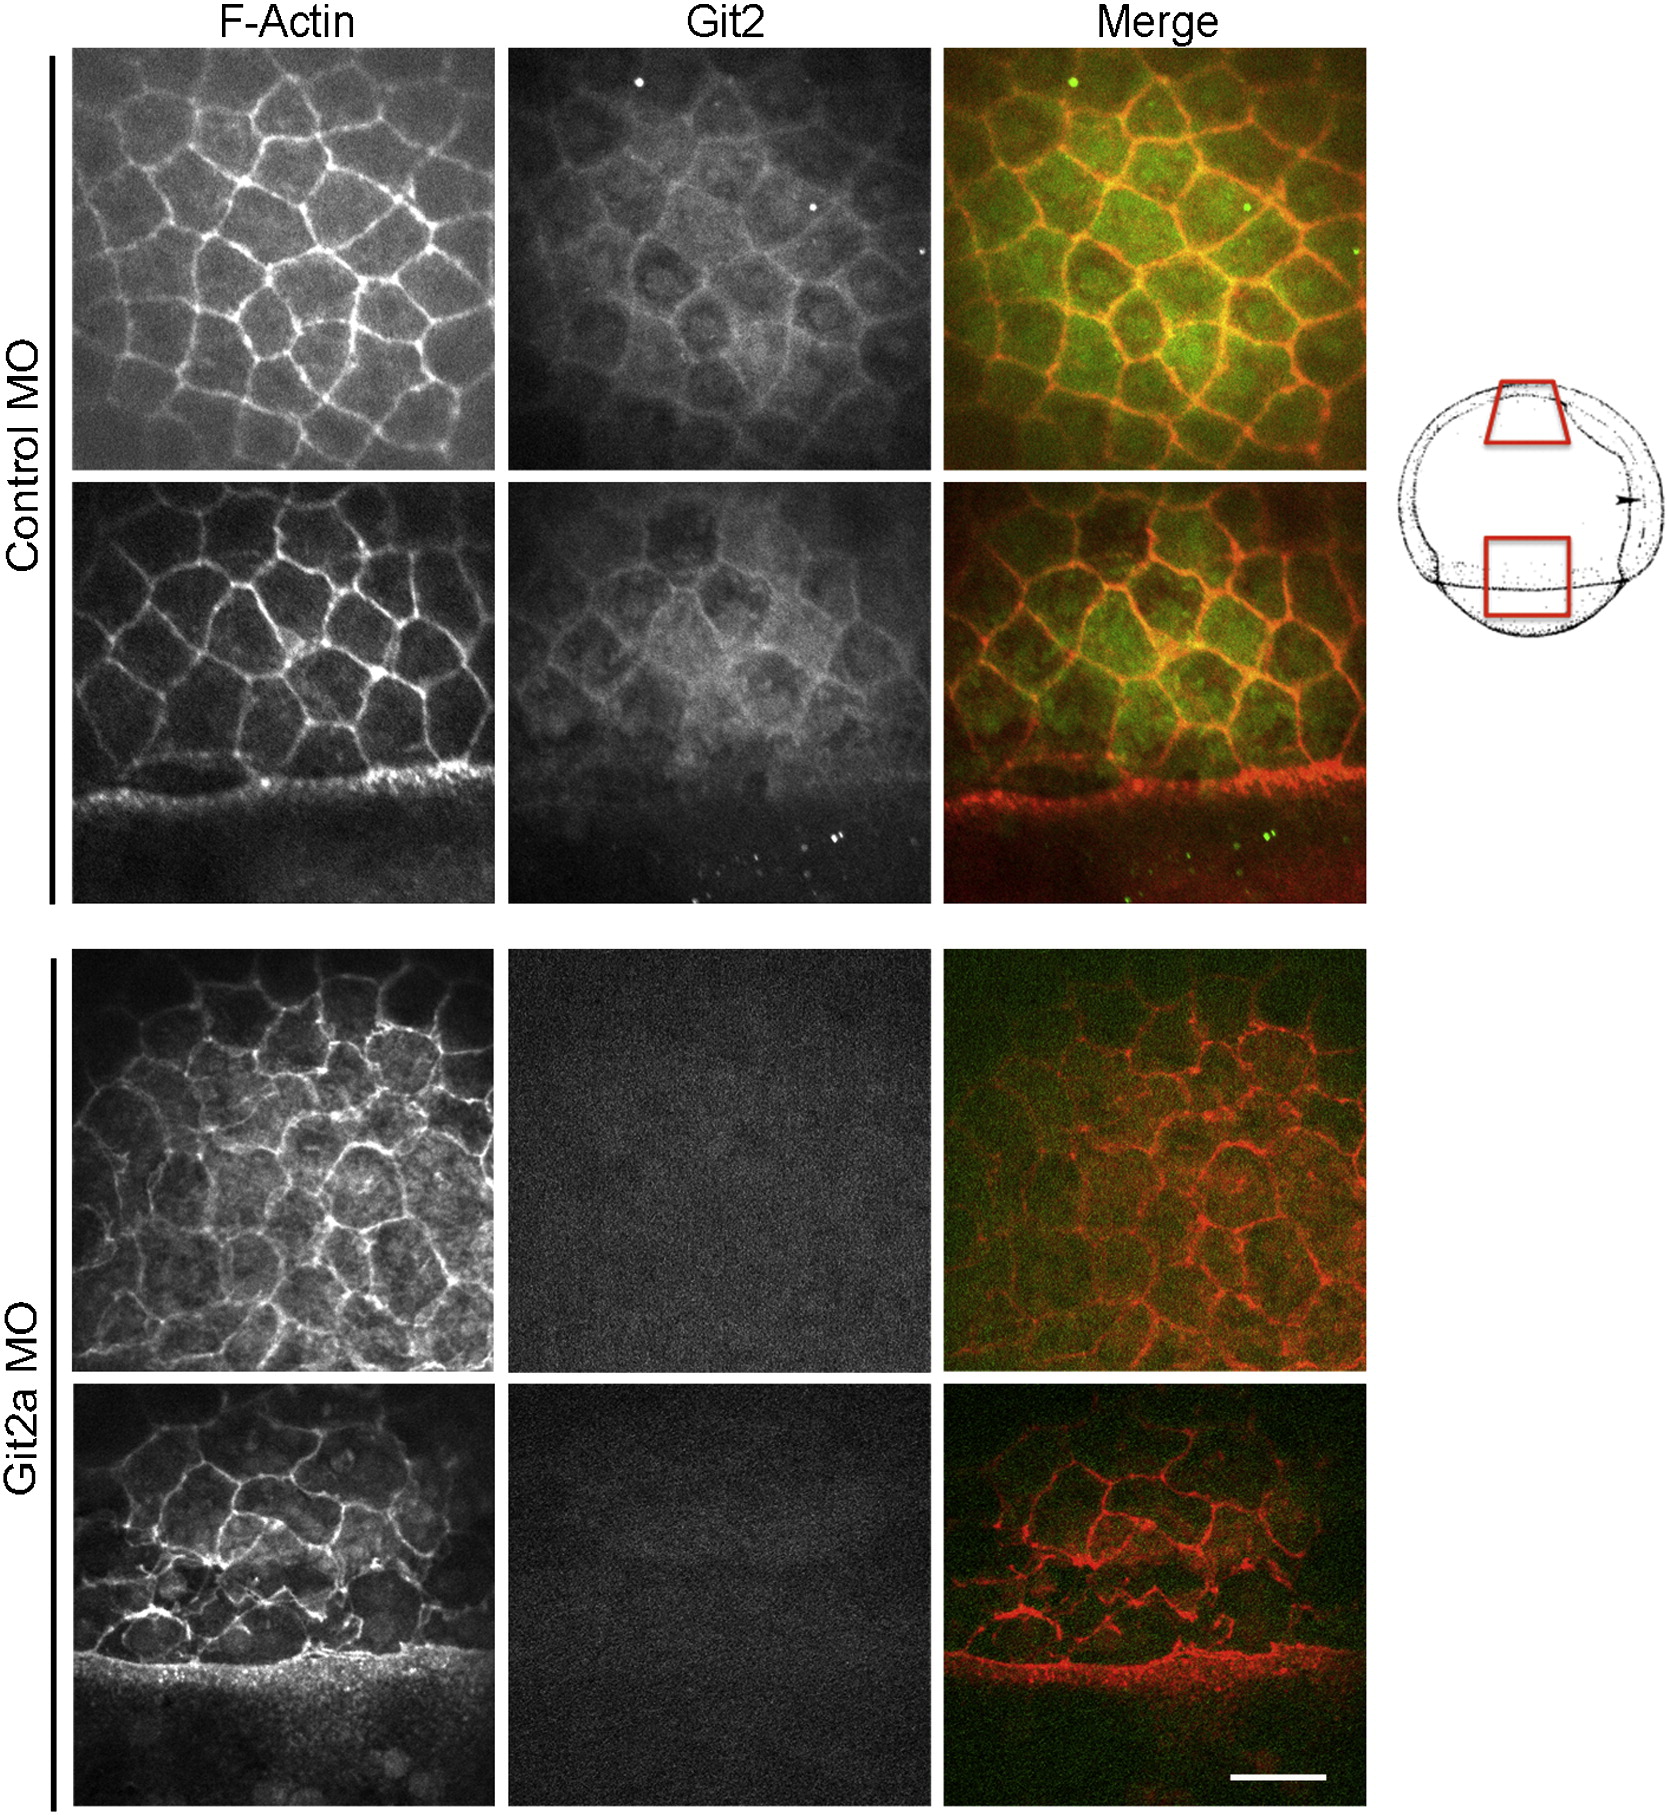
Fig. 4 Cell morphology is disrupted by Git2a knockdown. Representative images of cortical actin (red) and Git2 (green) distribution in EVL cells of control and git2a morphant embryos at 75% epiboly. Git2 expression was reduced and cell morphology, outlined by cortical actin, was significantly altered in git2a morphants. Scale bar, 50 μm. Animal pole region (upper row) and lateral region (lower row) demonstrated in control and Git2a morphant embryo are schematically represented on the right (Kimmel et al., 1995).
Figure Data
Acknowledgments
This image is the copyrighted work of the attributed author or publisher, and
ZFIN has permission only to display this image to its users.
Additional permissions should be obtained from the applicable author or publisher of the image.
Reprinted from Developmental Biology, 349(2), Yu, J.A., Foley, F.C., Amack, J.D., and Turner, C.E., The Cell Adhesion-associated Protein Git2 Regulates Morphogenetic Movements during Zebrafish Embryonic Development, 225-237, Copyright (2011) with permission from Elsevier. Full text @ Dev. Biol.