
- Title
-
Thyrotroph embryonic factor regulates light-induced transcription of repair genes in zebrafish embryonic cells
- Authors
- Gavriouchkina, D., Fischer, S., Ivacevic, T., Stolte, J., Benes, V., and Dekens, M.P.
- Source
- Full text @ PLoS One
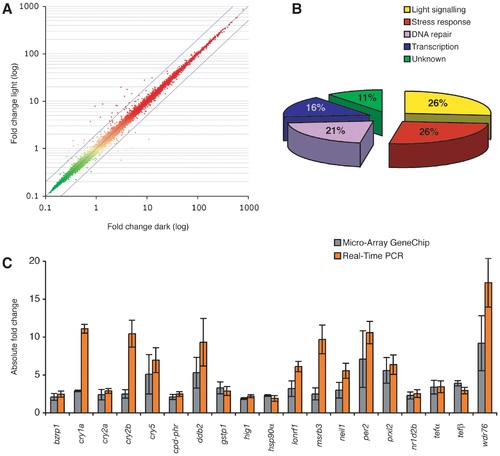
Screen for genes that display light-induced transcription. (A) Scatter plot showing the fold change in transcript level between embryos (9 h.p.f.) that were exposed to light and siblings maintained in darkness. Each dot represents one transcript of 14,900 genes screened. The reliability of the data is indicated by a green to red colour scale, with only the red dots representing transcripts that have a trustworthy differential expression. The outer blue lines demarcate the 2.0 fold boundaries when related to the average (central blue line). (B) Pie chart representing the ratios of the different processes in which light-induced genes function. (C) Validation by qPCR (n = 7) of the 19 light-induced transcripts that were identified by the Affymetrix micro-array GeneChip (n = 3, fold change >2). Grey bars indicate micro-array fold change and orange bars indicate qPCR fold change. Error bars indicate the standard deviation in all experiments. The qPCR fold changes shown were normalised using DD transcript levels, and differences between samples were corrected with β-actin mRNA levels. EXPRESSION / LABELING:
|
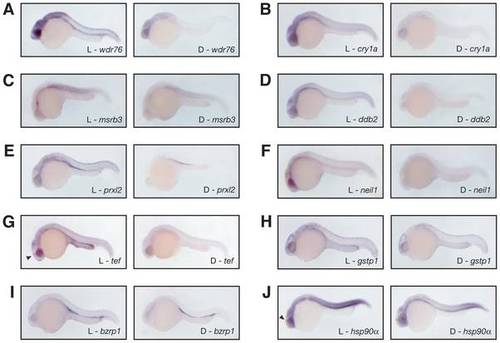
Light-induced transcripts are expressed ubiquitously. (A) In situ hybridizations of embryos (at 25 h.p.f.) that were exposed to light (left) or maintained in darkness (right) for the probe against wdr76, (B) cry1a, (C) msrb3, (D) ddb2, (E) prxl2, (F) neil1, (G) tef, (H) gstp1, (I) bzrp1, and (J) hsp90α. All light-induced transcripts are expressed ubiquitously at the early stages of zebrafish development. For most transcripts a gradient is observed with the highest level of expression at the anterior. The wdr76, cry1a, msrb3, tef, and neil1 transcripts are present at substantially higher levels in the retina. The hsp90α and tef transcripts show a distinctive presence in the pineal (indicated by arrowhead). EXPRESSION / LABELING:
|

miR219 and miR132 temporal expression pattern. (A) qPCR analysis showing the temporal oscillation of miR132 and (B) miR219 transcription during the first four days of development in embryos raised under a 12612 LD cycle. (C) Expression of period1 under the same conditions. White bars indicate the light and black bars the dark intervals. Note that low cycle quantification (Cq) values indicate high transcript levels and vice versa. |
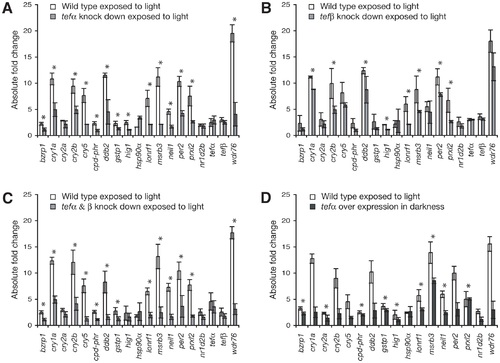
Tef regulates light-induced transcription. (A) Transcript level analysis by qPCR after 9 hours of light exposure in morpholino microinjected tefα knock down embryos (grey bars) compared to untreated embryos (white bars). Asterisks indicate significant difference in expression level. (B) Experiment as in A for morpholino-mediated knock down of tefβ in light exposed embryos. Demonstrating the reduced effect of tefβ knock down on the levels of most light-induced transcripts when compared with tefα knock down. (C) Morpholino-mediated double knock down of tefα and tefβ in light exposed embryos matches the tefα knock down result. (D) Embryos microinjected with tefα mRNA and directly transferred to DD. tef over expression results in elevated transcript levels when compared to untreated embryos maintained in DD. Fold changes were normalized with DD transcript levels, thus the knock down, over expression, and wild type light exposed transcript levels are compared to the wild type expression level in DD, which is set at zero on the Y-axis within each bar. Differences between samples were corrected with β-actin mRNA levels. These data clearly demonstrate that Tef mediates the regulation of light-induced transcription. EXPRESSION / LABELING:
PHENOTYPE:
|

Transcription of tefα is under circadian clock control. (A) qPCR analysis showing the temporal transcript levels of tefα and (B) tefβ during the first four days of development in embryos raised under a 12612 LD cycle. White bars indicate the light and black bars the dark intervals. (C) tefα mRNA levels on days 3, 4 and 5 in embryos entrained to LD cycles for the first 3 days followed by DD. Grey bars indicate the subjective light interval. The continuation of rhythmic expression in DD demonstrates that tefα transcription is regulated through an oscillator. (D) tefβ mRNA levels under the same experimental conditions as C. In all experiments the differences between samples were corrected with β-actin mRNA levels. Note that low Cq values indicate high transcript levels and vice versa. |