
- Title
-
Ewing sarcoma protein ewsr1 maintains mitotic integrity and proneural cell survival in the zebrafish embryo
- Authors
- Azuma, M., Embree, L.J., Sabaawy, H., and Hickstein, D.D.
- Source
- Full text @ PLoS One
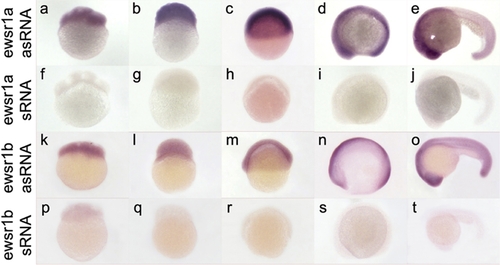
Initial Maternal and Subsequent Ubiquitious Expression of ewsr1b mRNAs in Zebrafish Embryonic Development. The images are lateral views of embryos stained by in situ hybridization using anti-sense RNA (a–e, k-o) or sense RNA (f–j, p–t) for ewsr1a and ewsr1b. The ewsr1a and ewsr1b were expressed ubiquitously at 4 cell (a and k), 256 cell (b and l), shield (c and m), 5 somite stage (d and s) and 24hpf (e and t). asRNA: anti-sense RNA, sRNA: sense RNA |

MO-Induced Knockdown of Zebrafish ewsr1b Results in Morphologic Abnormalities in the CNS Accompanied by Apoptosis. A. (a) uninjected, (b) control morpholino (MO), (c) ewsr1a MO , (d) ewsr1a MO with ewsr1a mRNA , (e) ewsr1b MO, and (f) ewsr1b MO and ewsr1b mRNA co-injected embryo. Both ewsr1a and ewsr1b MO injected embryos show dark cells (c and e) in the brain. The asterisk (*) indicates increased apoptosis and abnormal MHB. Co-injection of MO and mRNA rescued normal brain morphology (d and f). All of the images are lateral views of 24hpf zebrafish embryos. B. No increase of apoptosis in the bud stage (a–d), increased apoptosis in the CNS of ewsr1a and ewsr1b -MO injected embryos at 24hpf (g and h compared to e and f). Lateral views of wild type (a and e), control MO injected embryo (b and f), ewsr1a MO injected embryo (c and j) and ewsr1b MO injected embryo (d and h), after TUNEL staining. PHENOTYPE:
|
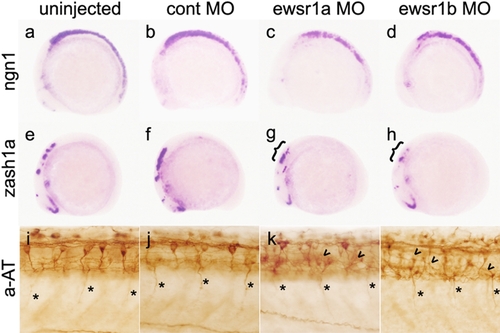
ewsr1 MO Injected Embryos Display a Reduction of CNS Neuronal cells and Disorganized Neuronal Network. (a, e and i) uninjected, (b, f and j) control MO, (c, g and k) ewsr1a MO and (d, h and l) ewsr1b MO injected embryo. (a–d) ewsr1a and ewr1b MO injected 12 somite embryos show marked reduction of ngn1 expression in the CNS (lateral view). (e–h) ewsr1a and ewr1b MO injected 12 somite embryos show marked reduction of zash1a expression in the CNS (lateral view). ({) indicate marked reduction in the hindbrain of zash1a. (i–l) Lateral views of the trunk in 24hpf embryos stained with acetylated tubulin (aAT) antibody. Arrowhead identifies disorganized axonal projections in ewsr1 MO injected embryos. Asterisk (*) marks motorneurons. EXPRESSION / LABELING:
PHENOTYPE:
|

MO Knockdown of p53 Rescues Morphologic Abnormalities in ewsr1 Knockdown Embryos. Lateral views of (a) uninjected, (b) control MO, (c) control MO and p53 MO, (d) ewsr1a MO, (d) ewsr1a MO+p53 MO injected embryo, (e) ewsr1b MO and (f) ewsr1b MO+p53 MO injected embryo at 24hpf. Asterisk (*) indicates the normal MHB structure (d and f). PHENOTYPE:
|
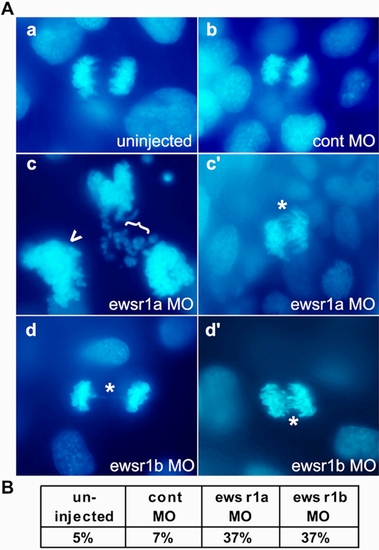
ewsr1 MO Injected Zebrafish Embryos Display Genomic Instability. A. Representative images of mitotic spindles from (a) uninjected, (b) control MO, (c and c') ewsr1a MO and (d and d') ewsr1b MO injected embryo. DNA was stained with DAPI (blue). Asterisks (*) identify chromosome bridges. (c) The cell appears to be the result of aberrant chromosomal segregation. ({) points to missegregated chromosomes and arrowhead (<) to a possible additional chromosome set. B. Percentage of chromosome bridges per hundred anaphase chromosomes of uninjected, control MO, ewsr1a MO and ewsr1b MO injected embryos at the 12 somite stage (12sm). PHENOTYPE:
|

ewsr1 MO Injected Zebrafish Embryos Display Mitotic Defects. A. Representative images of mitotic spindles from (a) uninjected, (b) control MO, (c) ewsr1a MO and (d) ewsr1b MO injected embryos. DNA was stained with DAPI (blue) and the spindles were visualized by α-tubulin staining (red). B. Score of abnormal mitotic spindles of uninjected, control MO, ewsr1a MO and ewsr1b MO injected embryos at the bud and the 12 somite stages (12sm). Approximately two hundred mitotic spindles (N = 193–234) were examined for each group. PHENOTYPE:
|
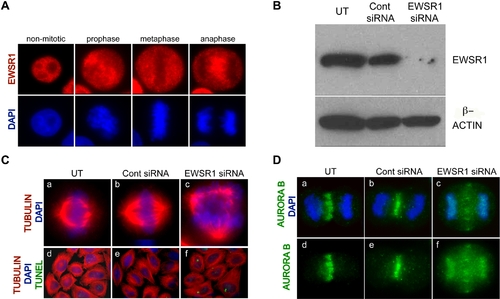
EWSR1 siRNA transfected Hela cells Display Mitotic Defects. A. EWSR1 localization in Hela cells during non-mitotic and mitotic-stages. EWSR1 was visualized by anti-EWSR1 antibody (red) and DNA was stained with DAPI (blue). B. EWSR1 protein (top panel) and β-Actin (bottom panel) visualized by western blotting. C. Representative images of mitotic spindles from (a and d) UT, (b and e) Cont siRNA and (c and f) EWSR1 siRNA transfected Hela cells. DNA was stained with DAPI (blue), the spindles were visualized by α-Tubulin (red) and the apoptotic cells were visualized by TUNEL assay (green). D. Representative images of Aurora B (green) with DNA (blue) (a–c), and Aurora B (green) without DNA (d–f). (a and d) UT, (b and e) Cont siRNA and (c and f) EWSR1 siRNA transfected Hela cells. UT: untransfected, Cont siRNA: control siRNA transfected, EWSR1 siRNA: EWSR1 siRNA transfected Hela cells. |
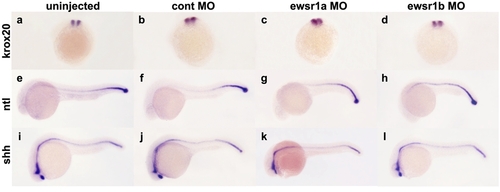
Lateral views of krox20, ntl and shh Embryos Demonstrate Normal Hindbrain, Axial Mesoderm, and Notochord Patterning. (a, e and i) uninjected, (b, f and j) control MO, (c, g and k) ewsr1a MO, and (d, h and l) ewsr1b MO injected embryo. |

Unillustrated author statements |