
|
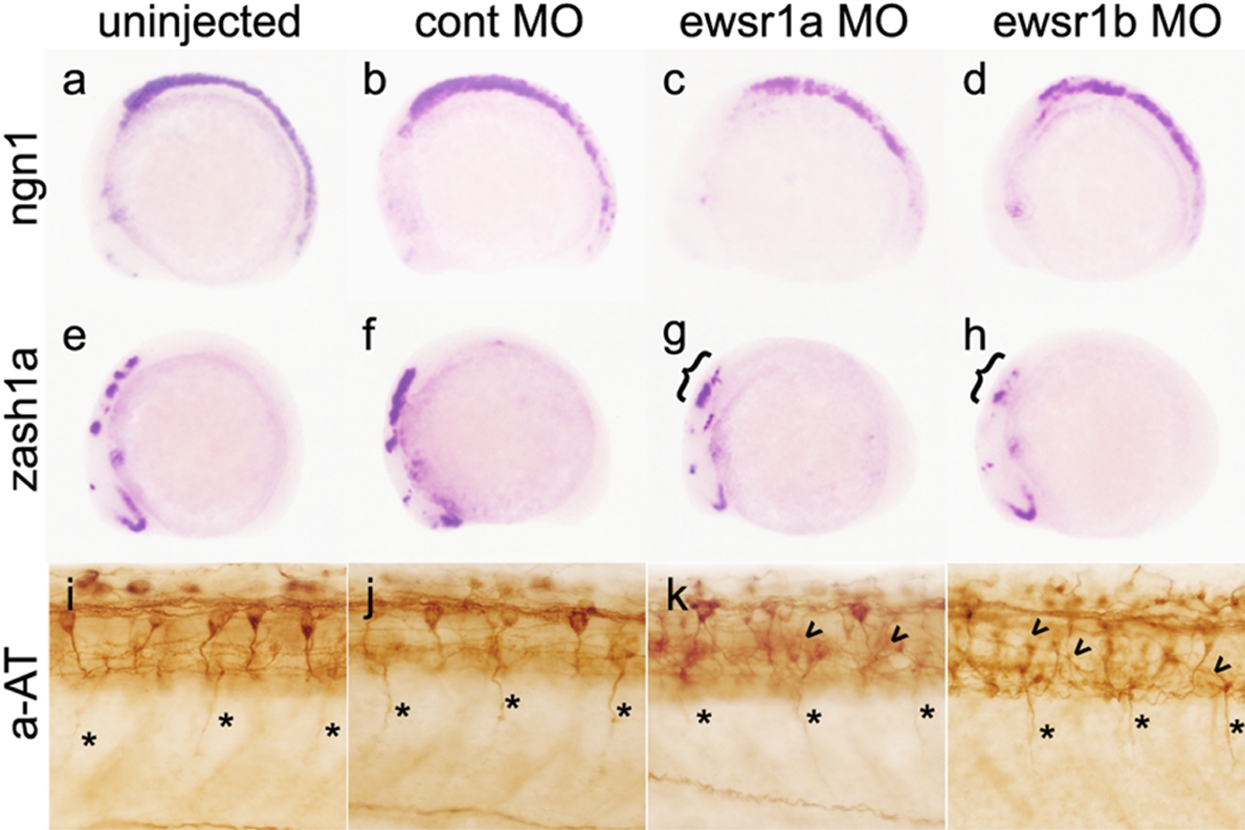
Fig. 4 ewsr1 MO Injected Embryos Display a Reduction of CNS Neuronal cells and Disorganized Neuronal Network. (a, e and i) uninjected, (b, f and j) control MO, (c, g and k) ewsr1a MO and (d, h and l) ewsr1b MO injected embryo. (a–d) ewsr1a and ewr1b MO injected 12 somite embryos show marked reduction of ngn1 expression in the CNS (lateral view). (e–h) ewsr1a and ewr1b MO injected 12 somite embryos show marked reduction of zash1a expression in the CNS (lateral view). ({) indicate marked reduction in the hindbrain of zash1a. (i–l) Lateral views of the trunk in 24hpf embryos stained with acetylated tubulin (aAT) antibody. Arrowhead identifies disorganized axonal projections in ewsr1 MO injected embryos. Asterisk (*) marks motorneurons.