
- Title
-
Insulin-like growth factor-binding protein-1 (IGFBP-1) mediates hypoxia-induced embryonic growth and developmental retardation
- Authors
- Kajimura, S., Aida, K., and Duan, C.
- Source
- Full text @ Proc. Natl. Acad. Sci. USA
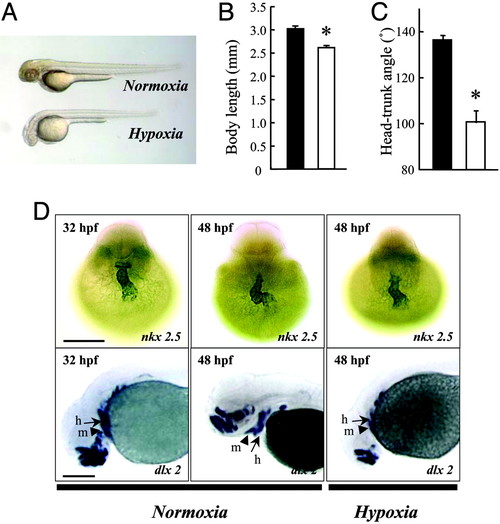
Hypoxia causes growth retardation and developmental delay. (A) Morphology of wild-type zebrafish embryos at 48 hpf after 24 h of normoxia or hypoxia treatment. (B and C) Effect of hypoxia on embryonic growth and development. Embryos at 24 hpf were transferred to normal (filled bars) or hypoxic (open bars) water. After 24 h, the total body length (B) and HTA (C) were measured. Values are expressed as means ± SE. (n = 28–36). *, P < 0.05. (D) Effect of hypoxia treatment on heart and head skeleton morphogenesis. Embryos raised in water with normal oxygen (normoxia) were fixed at 32 and 48 hpf. A subset of embryos was subjected to 24-h hypoxia exposure beginning at 24 hpf. Whole-mount in situ hybridization was performed by using nkx 2.5 (Upper) and dlx 2 (Lower) riboprobes. h, hyroid arch (arrows); m, mandibular arch (arrow heads). (Scale bar, 200 μm.) |
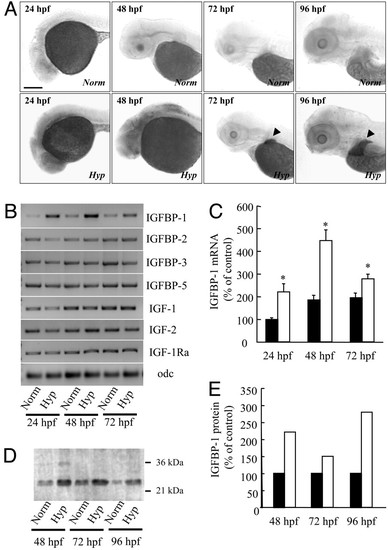
Hypoxia induces IGFBP-1 expression. (A) Hypoxia increased IGFBP-1 mRNA expression in many tissues in early embryonic stages (24 and 48 hpf) and in the liver (indicated by arrow heads) in advanced stages (72 and 96 hpf). Zebrafish embryos at various stages were transferred to normal or hypoxic water. After 24 h, the embryos were fixed and subjected to in situ hybridization analysis. (Scale bar, 200 μm.) (B) RT-PCR analysis of IGFBP-1, IGFBP-2, IGFBP-3, IGFBP-5, IGF-1, IGF-2, IGF-1 receptor-a (IGF-1Ra), and ornithinedecarboxylase (odf) in embryos of the indicated stages. Norm, normoxia; Hyp, hypoxia. (C) Relative IGFBP-1 mRNA levels normalized by the ornithinedecarboxylase mRNA level. Filled bars represent the normoxia group, and open bars represent the hypoxia group. Values are expressed as means ± SE. (n = 6). *, P < 0.05 compared with the corresponding normoxia group. (D) Western ligand blotting analysis. Wild-type embryos at various indicated stages were subjected to 24 h of hypoxia or normoxia treatment. The levels of IGFBP-1 protein were determined by ligand blotting with digoxigenin-labeled IGF-1. (E) Densitometric analysis results of D. Filled bars represent the normoxia group, and open bars represent the hypoxia group. |
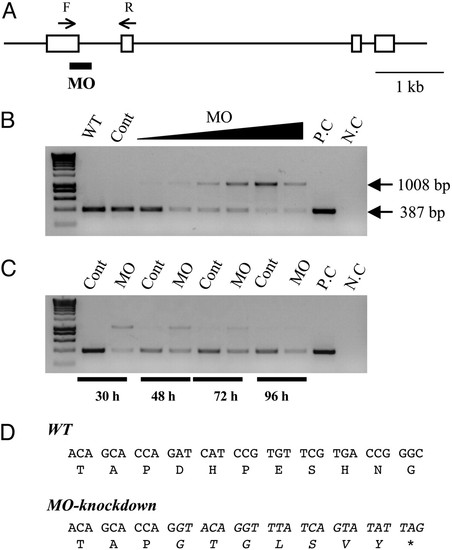
Knockdown of functional IGFBP-1 with splice-site-targeting MOs. (A) Structure of the zebrafish IGFBP-1 gene. Exons are shown as boxes, and introns are shown as lines. The splice donor site targeted by the IGFBP-1 MO is underlined. The primer set used for RT-PCR is shown as arrows. F, forward primer; R, reverse primer. (Scale bar, 1 kb.) (B) Dose-dependent effect after 0.5, 1, 2, 4, 8, or 16 ng MO1 was injected into embryos. The specific primer set amplified a 387-bp spliced form of IGFBP-1, whereas MO knockdown caused an aberrant splice form (1,008 bp). WT, wild-type; Cont, control MO; P.C., positive control of PCR; N.C., negative control of PCR. (C) Time-course effect. MO1 at dose of 2 ng was injected into embryos, and the knockdown effect was analyzed by RT-PCR at 30, 48, 72, and 96 h after the injection. (D) Sequence analysis of the IGFBP-1 cDNAs isolated from the wild-type and MO1-injected embryos. The sequence of the aberrantly spliced form is italicized. Note that the aberrant splicing form results in a coding-frame shift and a premature stop codon. |
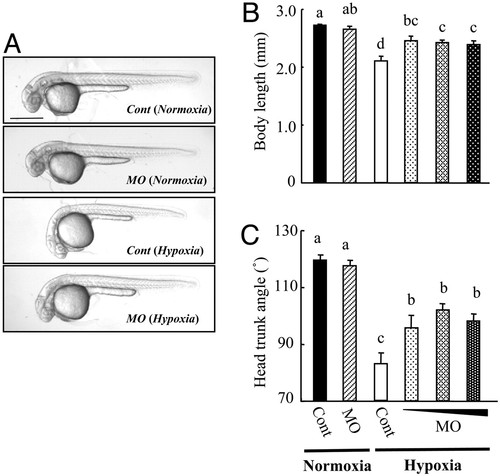
Knockdown of IGFBP-1 partially abrogates hypoxia-caused growth retardation and developmental delay. (A) Morphology of control MO- (Cont) or IGFBP-1 MO-injected embryos at 36 hpf. After raised to 12 hpf in normoxic water, the injected embryos were transferred to normal (normoxia) or hypoxic (hypoxia) water for 24 h. (Scale bar, 500 μm.) (B and C) Knockdown of IGFBP-1 attenuated hypoxia-induced growth and developmental retardations but had no effect under normoxia. Embryos injected with 2 ng of control MO or 1, 2, or 4 ng of MO1 were raised to 12 hpf and then transferred to normal or hypoxic water. After 24 h, their body lengths (B) and HTA (C) were measured. Values are expressed as means ± SE (n = 20–30). Groups with the same letters (a, b, c, or d) are not significantly different from each other (P < 0.05). |
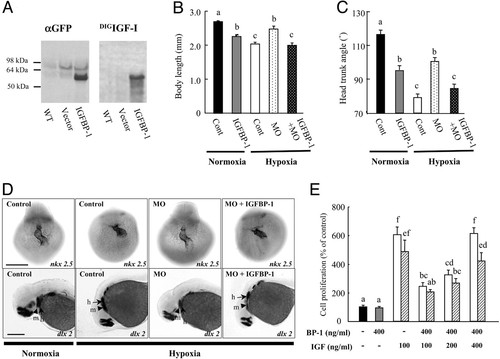
IGFBP-1 inhibits embryonic growth and development by inhibiting IGF actions. (A) Expression of a functional IGFBP-1 fusion protein. Embryos were injected with the IGFBP-1–EGFP construct (IGFBP-1) or empty vector (vector). At 36 hpf, the embryos were subjected to immunoblot (Left) and ligand blot analysis (Right). WT, wild-type embryos; vector, empty-vector-injected embryos; IGFBP-1, embryos injected with the IGFBP-1–EGFP construct. (B and C) Effect of IGFBP-1 overexpression under normoxia and hypoxia. Embryos injected with control MO (Cont), IGFBP-1 MO1 (MO), or IGFBP-1 MO plus IGFBP-1–EGFP overexpression vector at 12 hpf were transferred to normal (normoxia) or hypoxic water (hypoxia). The body length (B) and HTA (C) were measured 24 h later. Values are expressed as means ± SE (n = 20–34). Groups with common letters are not significantly different from each other (P < 0.05). (D) MO knockdown abrogates and IGFBP-1 overexpression restores hypoxia-induced delay in head skeleton and heart morphogenesis. Embryos injected with control MO, IGFBP-1 MO, or IGFBP-1 MO plus IGFBP-1–EGFP overexpression vector were transferred to normal or hypoxic water for 24 h and subjected to whole-mount in situ hybridization with nkx 2.5 (Upper) and dlx 2 (Lower). h, hyroid arch (arrows); m, mandibular arch (arrow heads). (Scale bar, 200 μm.) (E) IGFBP-1 inhibits IGF-stimulated zebrafish embryonic cell proliferation. Serum-starved, confluent cells were exposed to IGFBP-1 (400 ng/ml) with or without various concentrations of IGF-1 (open bars) or IGF-2 (shadow bars) in the presence of BrdUrd (20 μM) for 24 h. BrdUrd-labeled cells were detected by immunostaining. Values are expressed as means ± SE of two independent experiments, each of which was performed in duplicates. Groups with the same letters (a, b, c, d, e, or f) are not significantly different from each other (P < 0.05). EXPRESSION / LABELING:
|
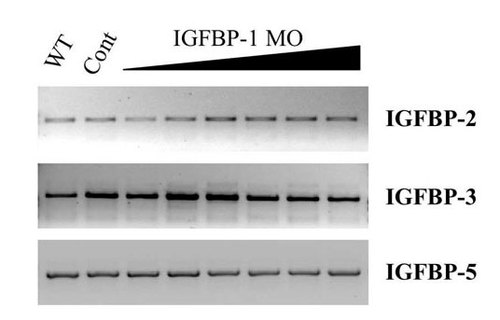
Knockdown of functional insulin-like growth factor-binding protein (IGFBP)-1 does not change the expression levels or splicing of other IGFBPs. RT-PCR was performed with specific primer sets for zebrafish IGFBP-2, IGFBP-3, and IGFBP-5 by using RNA isolated from WT, control MO (Cont), and various doses of IGFBP-1 targeting MO1-injected (0.5, 1, 2, 4, 8, and 16 ng) embryos as described in Materials and Methods. |