
- Title
-
Requirement of zebrafish pcdh10a and pcdh10b in melanocyte precursor migration
- Authors
- Williams, J.S., Hsu, J.Y., Rossi, C.C., Artinger, K.B.
- Source
- Full text @ Dev. Biol.
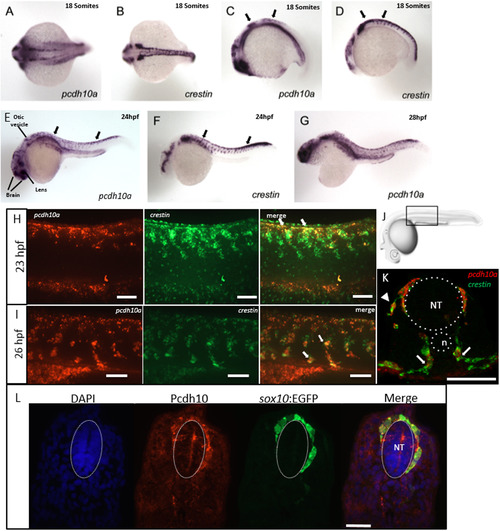
pcdh10a is expressed in a subset of crestin positive migratory neural crest cells (NCCs). (A-G) Whole-mount in situ hybridization (ISH) of pcdh10a and crestin expression during NCC migration in wildtype zebrafish embryos. (A) pcdh10a is expressed in a similar pattern to the NCC marker crestin (B) Dorsal views at 18 somites. (C,D) Lateral views at 18 somites. (E, F) Lateral views at 24 hpf. (G) Lateral view at 28 hpf. (H, I, K) Confocal micrograph Z-stack projections of double Fluorescent ISH (FISH) at 23hpf and 26 hpf respectively in wildtype zebrafish embryos coexpressing pcdh10a (Red) and crestin (Green). Lateral views with dorsal top, ventral down. White arrows mark examples of colocalization. Scale bars are 50 µm. (J) Area of imaging for H, I, K, L. (K) Representative image of a 12 µm cross-section of the embryo in (I). White arrows point to areas of colocalization, and white arrowheads point to NCCs in the dorsolateral pathway. (L) 12 µm cross-section through the trunk of an embryo stained for Pcdh10 (Red) immunofluorescence, with neural crest cells expressing sox10:EGFP (Green). Scale bar is 20 µm, images are a single 1 µm Z-plane. NT; Neural Tube, n; Notochord. Anterior is to the left in all whole mount images. EXPRESSION / LABELING:
|
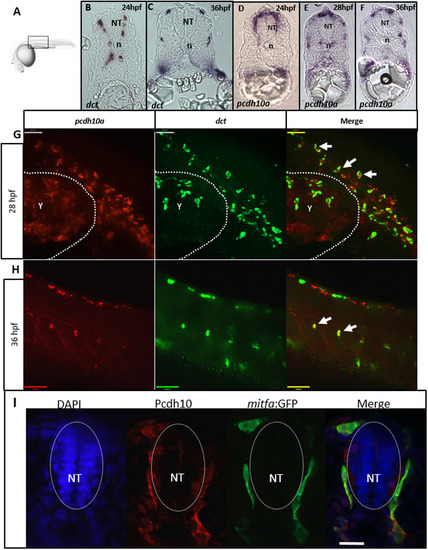
pcdh10a is expressed in migratory NCC-derived melanocyte precursors. (A) Schematic for imaging region for B-I. (B-F) Cross-sectional analysis (12 µm) of ISH comparing the melanocyte marker dct with pcdh10a temporally represented across trunk NCC migration time points. (B, C) dct expression in wildtype embryos at 24 hpf and 36 hpf respectively. (D-F) pcdh10a expression in wildtype embryos at 24 hpf, 28 hpf, and 36 hpf respectively. The expression of pcdh10a mirrors that of dct during melanocyte precursor migration suggesting pcdh10a is expressed in melanoblasts. (G, H) Lateral view of whole embryo double FISH comparing expression and colocalization of pcdh10a (red) with dct (green). White arrows are examples of colocalization. Scale bars are 50 µm. Single Z-plane images. (I) 12 µm cross sections through the embryo trunk stained for Pcdh10 immunofluorescence. Scale bar is 20 µm, images are a single 1 µm Z-plane, scale bar is 20 µm. NT is neural tube, n is notochord. Anterior is to the left in G-H. |
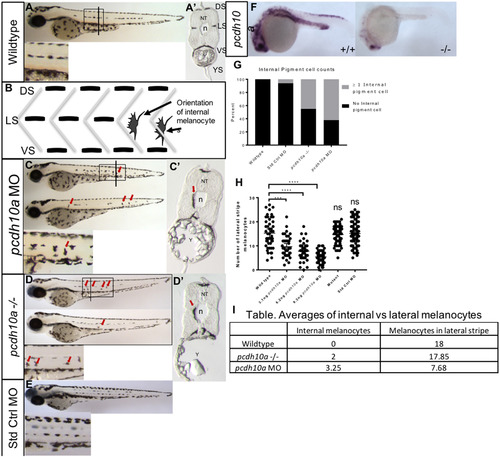
Reduction of pcdh10a results in defects in melanoblast migration. (A-D) Lateral views of 72hpf embryos. Line represents approximate position of cross-section. (A) Wildtype embryos with normal larval pigment pattern and all four stripes present, with no internal pigment cells. (B) Schematic showing the difference in morphology and placement of internal pigment cells vs the other correctly patterned stripes (C) Embryos injected with 6 ng pcdh10aMorpholino containing several internal pigment cells. (D) pcdh10a -/- embryos also contain internal pigment cells. (A′-D′) cross-sectional views of a representational embryo from A-C. (E) AB embryos injected with 6 ng standard control Morpholino show no internal pigment cells. (F) ISH at 25hpf comparing wildtype embryo pcdh10a expression to pcdh10-/-mutant pcdh10a expression. (G) Quantification of the number of embryos with at least one internal pigment cell. (H) Quantification of the number of melanocytes at the lateral stripe on both sides of embryo. (I) Table, quantification of the ratio between number of internal melanocytes vs number of lateral stripe melanocytes. DS. Dorsal Stripe, LS. Lateral Stripe, VS. Ventral Strip, YS. Yolk Strip, NT, Neural Tube, n, Notochord, Y Yolk. Arrows show locations of example internal pigment cells. ns, Not Significant. EXPRESSION / LABELING:
PHENOTYPE:
|
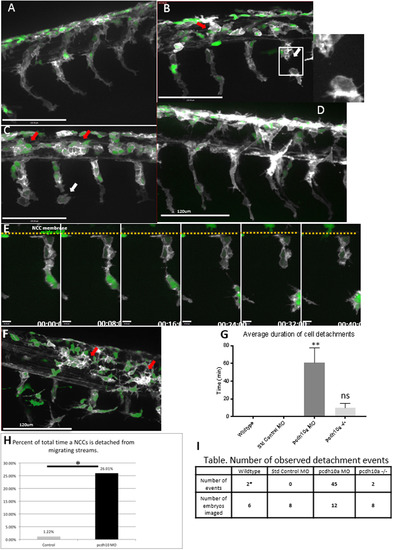
pcdh10a knockdown causes defects in NCC migration.(A-D, F) Lateral views of double transgenic zebrafishTg(sox10:mRFP;mitfa:GFP), membrane RFP has been changed to gray scale. (A) Control non-injected NCCs 28hpf. (B,C) Lateral view of pcdh10a morphant NCCs at 28hpf show defects in NCC migration, including in mitfa+ melanoblasts. White arrows mark NCCs that have detached from other NCCs in the migrating streams. Red arrows mark NCCs that have aggregated within the neural tube domain. (D) Lateral view at 28hpf of embryos injected with Standard Control MO. Scale bars are 120 µm. (E) Time series showing the detachment of a neural crest cell in pcdh10a MO injected embryos, scale bars are 10 µm. (F) pcdh10a -/-Tg(sox10:mRFP;mitfa:GFP) embryo with subtle NCC aggregations (red arrows). (G) Quantification of the duration of cell detachment events across all samples. (H) Percent of total time NCCs are detached from other NCCs in Control and Morphant embryos.(I) Table, comparison of the number of embryos imaged and the number of detachment events that occurred across all samples. * denotes P value of 0.0062. |
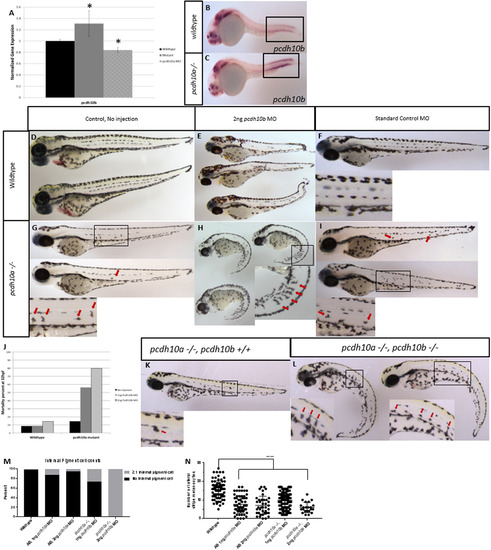
pcdh10b is up-regulated and genetic compensates inpcdh10a mutant embryos (A) Real-time PCR comparing wildtype embryos to pcdh10a-/- mutants, normalized to ef1a, * denotes P-Value< 0.05. (B-C) ISH probing for pcdh10bexpression in (B) wildtype and (C) pcdh10a-/- mutants. (D-I) Whole-mount lateral views of 72hpf embryos. Wildtype embryos with no Morpholino injected (D), 2 ng pcdh10bMorpholino injected (E), Standard control Morpholino injected (F). (G,H,I) Homozygous pcdh10a-/- mutants. With no Morpholino injected (G), 2 ng Morpholino injected (H), Standard control Morpholino injected (I). Insets are blown up images to highlight internal melanocytes (red arrows) or lack of internal melanocytes. (J) Mortality rate percent of wildtype embryos and mutant embryo injected with pcdh10bMorpholino. (K, L) Representative images of sibling embryos at 72hpf from the same cross. (K) pcdh10a-/- embryo that is wildtype for pcdh10b. (L) Embryos that are homozygous mutants for both pcdh10a and pcdh10b paralogs. Insets are blown up images to highlight internal melanocytes (red arrows). (M) Quantification of the percent of embryos with internal pigment cells., (N) Quantification of the number of melanocytes in the lateral stripe, **** denotes P-value of 0.0001. (M, N) wildtype n = 80, AB 1 ng pcdh10a MO n = 59, AB 2 ng pcdh10a MO n = 39, pcdh10a -/- 1 ng pcdh10b MO n = 113, pcdh10a -/-, 2 ng pcdh10b MO n = 22. EXPRESSION / LABELING:
PHENOTYPE:
|

Pcdh10a Morpholino causes deletion of exon 2. (A) Schematic of pcdh10a pre-mRNA with ATG and e2i2 MO site and PCR primer binding sites. (B) RT-PCR to confirm spice site change in e2i2 MO-injected embryos, in this case, a deletion of exon 2. (C) 6ng E2i2 MO injection into p53 mutant fish shows the same phenotype with internal pigment cells (red arrows). (D) 10ng pcdh10a ATG Morpholino injected into AB mildly phenocopies E2i2 MO with internal pigment cells (red arrow). PHENOTYPE:
|
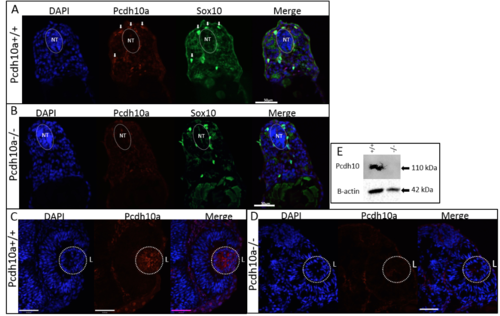
pcdh10aCO1000 mutant does not make functional Pcdh10a protein. |
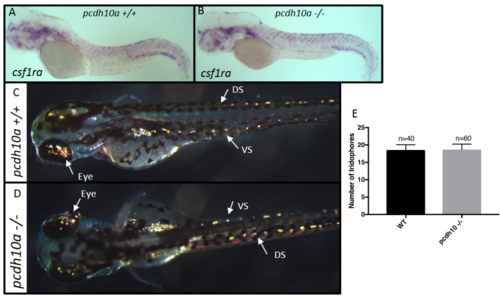
Removal of pcdh10a does not cause reduction of iridophores or xanthoblasts. (A, B) ISH at 2 dpf for xanthoblast marker csf1ra in (A) wildtype embryos, (B) pcdh10a -/- mutant embryos. (C,D) Incident light images of 3 dpf embryos to show yellow reflective iridophores in the eye, dorsal stripe (DS), and ventral stripe (VS). (E) Quantification of iridophores shows there was no significant difference in the number of iridophores located in the dorsal stripe. EXPRESSION / LABELING:
PHENOTYPE:
|
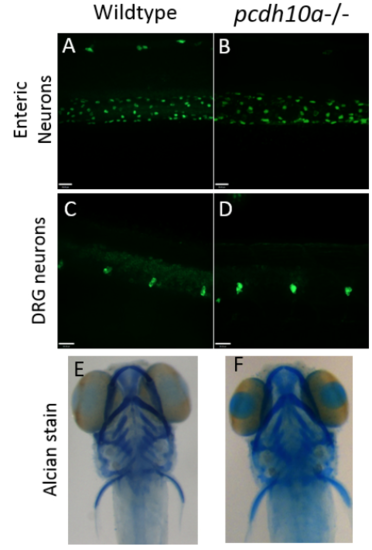
Removal of pcdh10a does not cause defects in other neural crest derivatives. (A-D) Whole-mount Immunofluorescence with HuC antibody at 5 dpf (A, B) No difference was observed in Enteric neurons between wildtype (A) and pcdh10a -/- (B) embryos. (C,D) No observed difference in Dorsal root ganglia (DRG) between wildtype (C) and pcdh10a -/- (D) embryos. (E, F) Alcian stain at 5 dpf. No observed difference in craniofacial structure between wildtype (E) and pcdh10a -/- (F) embryos. |
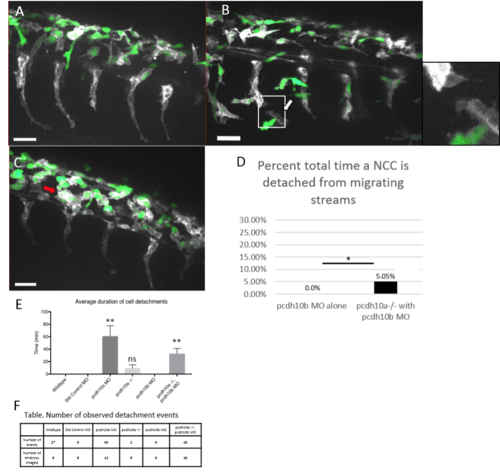
Knockdown of pcdh10b in pcdh10a mutants restores NCC migration defect. Lateral views of double transgenic zebrafish Tg(sox10:mRFP,mitfa::GFP), membrane RFP has been changed to grayscale. (A) Control wildtype embryos injected with pcdh10b MO NCCs 28hpf. (B, C) Lateral view of pcdh10a mutants injected with pcdh10b MO NCCs at 28hpf show defects in NCC migration, including in mitfa+ melanoblasts. White arrows mark NCCs that have detached from other NCCs in the migrating streams. Red arrows mark NCCs that have aggregated within the dorsal domain. (D) Percent of total time NCCs are detached from other NCCs in pcdh10b MO alone and pcdh10a-/- injected with pcdh10b MO embryos. * denotes P value of .035. Scale bar is 30um. (E) Quantification of the duration of cell detachment events across all samples, ** denotes P value of .006 (F) Table, comparison of the number of embryos imaged and the number of detachment events that occurred across all samples. |
Reprinted from Developmental Biology, 444 Suppl 1, Williams, J.S., Hsu, J.Y., Rossi, C.C., Artinger, K.B., Requirement of zebrafish pcdh10a and pcdh10b in melanocyte precursor migration, S274-S286, Copyright (2018) with permission from Elsevier. Full text @ Dev. Biol.