
- Title
-
S1pr2/G?13 signaling regulates the migration of endocardial precursors by controlling endoderm convergence
- Authors
- Xie, H., Ye, D., Sepich, D., Lin, F.
- Source
- Full text @ Dev. Biol.
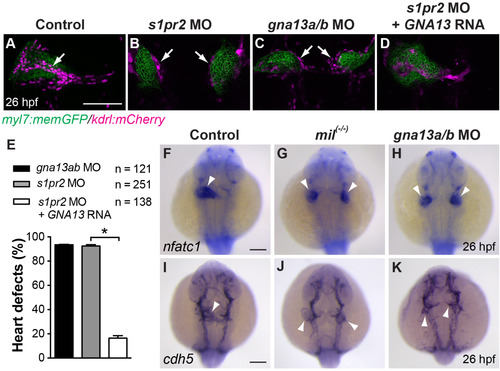
S1pr2/G?13 signaling is required for the migration, but not differentiation, of endocardial precursors. (A-D) Projections of four single XY confocal Z-planes of 26 hpf-Tg(myl7: memGFP/kdrl: mCherry) embryos raised at 28.5 �C, showing the myocardium (green) and endothelial cells (magenta). Arrows indicate the presumptive endocardium among the endothelial cells, which formed inside of cardiac population in control embryos (A), but outside of cardiac population in the mutant (B, C). (E) Frequencies of heart defects in 26-hpf embryos injected with gna13a/b MO, s1pr2 MO, or s1pr2 MO and a human G?13 RNA (GNA13) raised at 28.5 �C, as assessed by epifluorescence imaging. *, P<0.01. Bars indicate the mean�s.e.m. (F-K) Expression of nfatc1 and cdh5, as detected by whole-mount in situ hybridization (ISH), in control, mil mutant, and gna13a/b MO-injected embryos. White arrowheads: endocardial populations. All images are dorsoanterior views with anterior up. Scale bars: 100 �m. |

In G?13-deficient embryos, endocardial precursors fail to migrate to the midline, instead moving toward the myocardial precursors. Epifluorescence time-lapse experiments were performed on control (A-H) and gna13a/b MO-injected (A?-H?) Tg(fli: EGFP/nkx2.5: Kaede) embryos (Supplementary movie 1) from 13 to 20 s Embryos were exposed to UV light at 10 s for 1 min to convert Kaede fluorescence from green to red (presented as magenta). Snapshots from movies showing the migration of endocardial (green, outlined by white dots in A, A?, white arrowheads in F-H) and myocardial (magenta, outlined by yellow dashed-lines in A, A?; yellow arrowheads in F?-H?) precursors at the stages indicated. White arrows: the leading region of migrating endocardial population. Asterisks: Non-myocardial cells labeled by Nkx2.5-Kaede. Dorsoanterior views. Scale bars: 100 �m. EXPRESSION / LABELING:
PHENOTYPE:
|
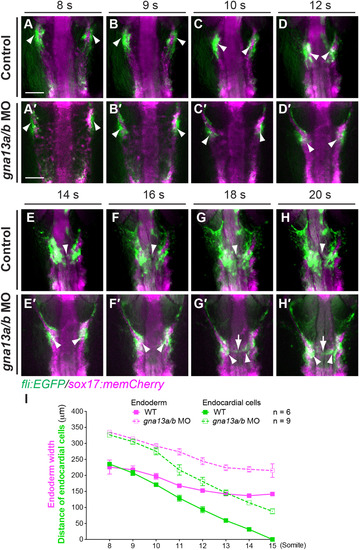
In G?13-deficient embryos, the medial migration of endocardial precursors is affected by impaired endoderm convergence. Epifluorescence time-lapse experiments were performed on control (A-H) and gna13a/b MO-injected (A?-H?) Tg(fli: EGFP/sox17: memCherry) embryos (Supplementary movie 2). (A-H?) Snapshots from movies, showing the migration of endocardial precursors (green, arrowheads) and convergent movement of the endoderm (magenta) at the stages indicated. As the embryos are curved, only the lateral boundaries of the endodermal sheet were focused, the midline region was out of focus. Dorsoanterior views. White arrowheads: endocardial precursors that migrated to the midline briefly. (I) Endoderm width (magenta) plotted against distance between the two populations of endocardial cells (green) at the stages indicated. Data are mean�s.e.m. Scale bars: 100 �m. EXPRESSION / LABELING:
PHENOTYPE:
|
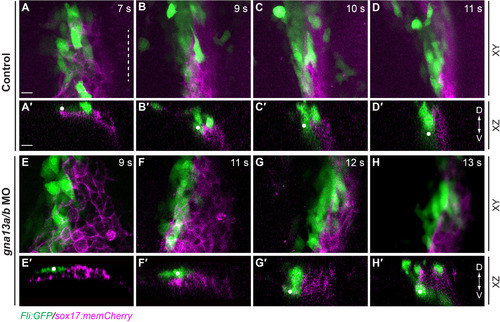
In G?13 morphants, the subduction of endocardial precursors is impaired. In toto confocal time-lapse experiments were performed on control (A-D?) and gna13a/b MO-injected (E-H?) Tg(fli: fli-GFP/sox17: memCherry) embryos (Supplementary movie 4). Snapshots from the movies showing endocardial cells (green, the individual cells tracked are labeled with dots) and the endoderm (magenta) at the stages indicated, in the XY (A-H), and XZ (A?-H?) planes. Dashed line: midline. D: dorsal; V: ventral. Scale bars: 20 �m. EXPRESSION / LABELING:
PHENOTYPE:
|

Fn assembly is disrupted in G?13 morphants. Whole-mount Fn immunostaining was performed in control and gna13a/b MO-injected Tg(fli: EGFP/sox17: memCherry) embryos raised at 25 �C at the stages indicated. (A-D) Fn assembly (magenta) in embryos at 10 s (A, C) Projections of XY views of confocal Z-stacks spanning the endocardial-cell populations (green), the endoderm (false-colored cyan). (A?, C?) Projections of a subset of z-plane in the region shown in boxes in A-F. (A??, C??) A single z-plane in A?,C?. (A???, C???) Images of XZ transverse sections of the regions indicated by white lines in A,C. (B-D) Relative Fn intensity over the endocardial-cell population, as determined by plot profile measurement on XY image of single z plane on A??,C??. Results from individual embryos are shown in gray and average intensity in control (B, blue) and gna13a/b MO-injected red (D, red) embryos. (E-H) Fn assembly (magenta) in embryos at 16 s (E, F) Projections of XY views of confocal Z-stacks spanning the endocardial-cell populations (green). (E?, F?) Fn assembly only (magenta) in E, F. (E??, F??) Images of XZ transverse sections of the regions indicated by white lines in E, F. (G) Fn fibril directions as determined by FibrilTool. (H) Localization of Fn fibrils in the dorsal, ventral or middle of the endodermal sheet. White and yellow arrowheads: enrichment of Fn fibrils in control and gna13a/b MO-injected embryos, respectively; yellow dashed lines: midline; D: dorsal; V: ventral; A: anterior, P: posterior; ML (mediolateral). Scale bars: 10 �m. EXPRESSION / LABELING:
PHENOTYPE:
|
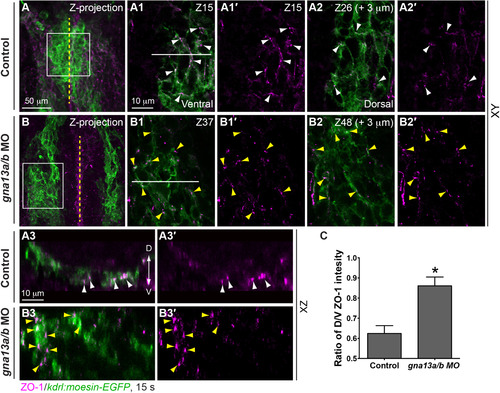
In G?13-deficient embryos, the endocardial-cell architecture is disrupted. Whole-mount ZO-1 immunostaining was performed in Tg(kdrl: moesin-GFP) embryos at 15 s (A, B) Projections of confocal Z-stacks of endocardial cells showing ZO-1 expression (magenta) in endocardial precursors (green). (A1-A2?, B-B2?) Single confocal Z-plane images of areas shown in boxes in A, B. (A1, B1) A Z-plane image in the ventral region showing the ZO-1 expression. (A1?, B1?) Images of ZO-1 expression only in A1, B1. (A2, B2) A Z-plane image 3 �m dorsal to that in A1, B1. (A2?, B2?) Images of ZO-1 expression only in A2, B2. (A3, A3?, B3, B3?) Images of XZ transverse sections of the regions indicated by white dashed lines in A1, B1. (C) Ratio of ZO-1 intensity in the dorsal/ventral region of endocardial cells. 5 embryos in each group. P<0.001. Yellow dashed line: midline; white and yellow arrowheads: ZO-1 expression in control and gna13a/b MO-injected embryos, respectively; D: dorsal; V: ventral. EXPRESSION / LABELING:
PHENOTYPE:
|

In G?13 morphants, Fn fibrils in the regions in which endocardial and myocardial precursors reside are disrupted. Whole-mount Fn immunostaining was performed in control (A-E, n=6) and gna13a/b MO-injected (A?-E?, n=7) Tg(nkx2.5: ZsYellow/sox17: memCherry) embryos at 13 s (A, A?) Projections of XY views of confocal Z-stacks spanning the left-hand side of the embryo, with labeled myocardial precursors (blue), endoderm (magenta), and Fn fibrils (green). (B, B?) A single Z-plane from Z-stacks in A, A?. (C-E, C?-E?) Images of XZ transverse sections (corresponding colored boxes on the far right corners) of the regions indicated by horizontal pink, yellow and cyan lines in A, A?. Pink dots: presumptive endocardial cell populations; yellow dots: myocardial cell populations; pink arrowheads: leading regions of myocardial populations; yellow arrowheads: regions between endocardial and myocardial precursors; yellow dashed line: midline; D: dorsal; V: ventral. Scale bars: 20 �m. EXPRESSION / LABELING:
PHENOTYPE:
|

Defects in myocardial migration in the context of global G?13 deficiency are partially rescued when endocardial precursors are eliminated. (A-F?) Snapshots of movies taken of Tg(fli: EGFP/nkx2.5: Kaede) embryos injected with gna13a/b MO, either alone (A-F, n=8) or with the etv2 MO (A?-F?, n=8) (Supplementary movie 5), showing the migration of endocardial (green, outlined by white dots, arrowheads) and myocardial (magenta, outlined by yellow dots and arrowheads) precursors at the stages indicated. 10 s-embryos were exposed to UV light for 1 min to convert Kaede fluorescence from green to red (presented as magenta). Asterisks: Non-myocardial cells labeled with Nkx2.5-Kaede; green arrowheads: non-endothelial cell population labeled with Fli-EGFP, which was also reported previously. Dorsoanterior views (Craig et al., 2015). (G-J) Expression of myl7 and cdh5 in 26 s embryos, as detected by ISH. Yellow arrowheads: myocardial cells; white arrowheads: endothelial cells. All images are dorsoanterior views with anterior up. (K) Distance between the two populations of endocardial cells in embryos injected with gna13a/b MO, either alone (A-F) or with the etv2 MO (A?-F?), at indicated stages. Data are mean�s.e.m. #: P<0.05 between the two experimental groups. (L) Frequencies of heart defects (two separated and fused hearts) in the indicated embryos in G-J. The number of embryos in each sample is shown. Scale bars: 100 �m. EXPRESSION / LABELING:
PHENOTYPE:
|
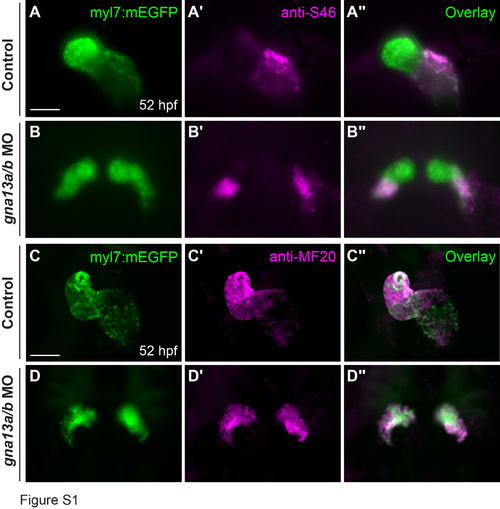
Bilaterally located hearts in G?13-deficient embryos have an atrium and a ventricle. Expression of atrium-specific myosin heavy chain 6 (S46, magenta) (A-B'') and myosin heavy chain (MF20, magenta) (C-D'') as detected by whole-mount immunostaining, in EGFP-labeled (green) control and gna13a/b morphant hearts. Scale bars: 50 ?m. |

Formation and organization of the vasculature is normal in S1pr2/G?13- deficient embryos. (A-B') Expression of the vascular endothelial marker, fli, as detected by ISH in control (A) and mil mutant (B) embryos at 26 hpf. (A-B) Dorsoanterior view with anterior up. (A'-B') Lateral view. White dots outline endocardium. (C-D') EGFP-labeled vasculature in control and gna13a/b MO-injected Tg(fli:EGFP) embryos at 28hpf. (C'-D') Magnification of areas shown in boxes in C-D. Lateral view. Scale bars: 100 ?m. |

The relative positions of endocardial and myocardial precursors are disrupted in G?13-deficient embryos. Confocal images showing endocardial (green) and myocardial (magenta, revealed by Kaede immunostaining) precursors in control and gna13a/b MO-injected embryos at the indicated stages. (A, C, E, G) XY projections of confocal Z-stacks (B, D, F, H) Higher-magnification views of the areas shown in boxes in A, C, E, G. (B'-B'', D'-D'', F'-F'', H'-H'') XZ transverse sections from the areas indicated by white and yellow lines in B, D, F, H. Yellow arrowheads: presumptive endocardial precursors; white arrowheads: endothelial cells. D: dorsal; V: ventral. Scale bars: 20 ?m. |

Endodermal expression of G?13 rescues endocardial-cell migration in the context of global G?13 deficiency. Epifluorescence images of anterior region of 26-hpf Tg(fli:EGFP) (A-B) and Tg(fli:EGFP/sox17:mCherry-2A-gna13a) (C-D) embryos. The endoderm is marked by mCherry 2 (magenta in C, D) and endothelial cells are marked by EGFP (green; white arrowheads). Dorsoanterior view with anterior up. Scale bar: 100 ?m. |
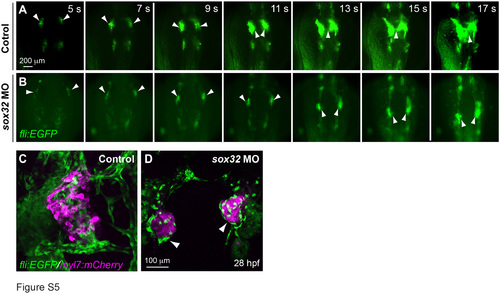
Embryos lacking endoderm fail to undergo endocardial migration and display disorganized heart tubes. (A-B) Snapshots of epifluorescence time-lapse movies of control or sox32 MO-injected Tg(fli:EGFP) embryos at the indicated stages (supplementary movie 3). White arrowheads: endocardial precursors. (C-D) Confocal Z-stack images of 28-hpf Tg(myl7:mCherry/fli:EGFP) embryos, showing myocardium (magenta) and endocardium (green). White arrowheads: endocardium located at the outer layer. Dorsoanterior view with anterior up. |

Subduction of endocardial precursors is impaired in G?13 morphants. (A-J) XY projections of confocal Z-stacks of anterior endoderm (magenta) and endocardial precursors (green) in control and gna13a/b MO-injected embryos at the indicated stages. (A'-J') Images of XZ transverse sections from the areas indicated by yellow lines in A-J. Dashed line: midline; arrowheads: endocardial precursors; D: dorsal; V: ventral. Scale bars: 20 ?m. |
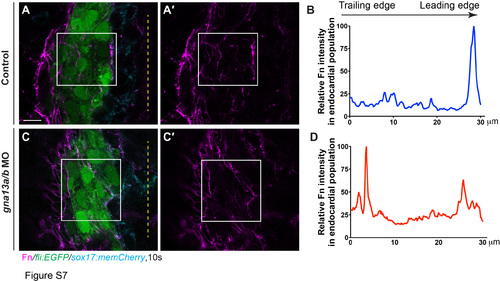
Method for quantifying Fn intensity in the endocardial population. (A-A', C-C') Single XY confocal Z-plane images were used to quantify the Fn intensity (magenta) in the endocardial populations (green) at 10s. (A', C ') Fn only. The rectangular areas, which span the leading and trailing regions of the endocardial population, were used for plot profile analysis. Yellow dashed line: midline. (B, D) The relative Fn intensity in the endocardial population as determined by plot profile measurement in A' and C'. Scale bars: 10 ?m. |
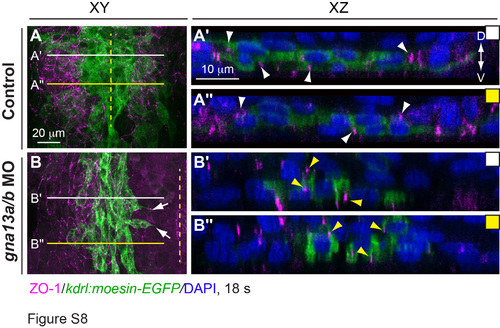
Epithelial organization of endocardial cells is disrupted in G?13 morphants. ZO-1 expression (magenta) as detected by whole-mount immunostaining in Tg(kdrl:moesin- EGFP) embryos at 18s. (A, B) Projections of confocal Z-stacks spanning the endocardial precursors (green, the left side of endocardial population in B). (A??-B????) Images of XZ transverse sections of the regions indicated by lines in A, B. White and yellow arrows: ZO-1 expression in endocardial cells of the control and gna13a/b MO-injected embryos, respectively. Yellow dashed line: midline; D: dorsal; V: ventral. |
Reprinted from Developmental Biology, 414, Xie, H., Ye, D., Sepich, D., Lin, F., S1pr2/G?13 signaling regulates the migration of endocardial precursors by controlling endoderm convergence, 228-43, Copyright (2016) with permission from Elsevier. Full text @ Dev. Biol.