
- Title
-
Convergence and extension movements mediate the specification and fate maintenance of zebrafish slow muscle precursors
- Authors
- Yin, C., and Solnica-Krezel, L.
- Source
- Full text @ Dev. Biol.
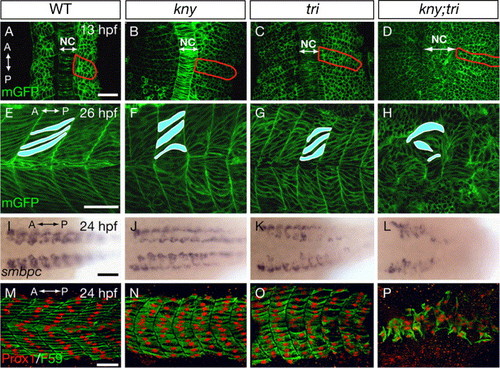
Loss of Kny and Tri function impairs zebrafish slow muscle development. (A–D) Confocal images of dorsal views of embryos expressing mGFP. Red lines delineate the outline of the 5th somite. (E–H) Trunk region of day 1-embryos expressing mGFP, lateral views. (I–L) Dorsal views showing smbpc RNA expression in the slow muscles. (M–P) Lateral views of embryos stained with F59 antibody (green) that labels the cytoplasm of the slow muscle cells and Prox1 antibody (red) that labels their nuclei. A, anterior. P, posterior. NC, notochord. Scale bars: (A–H, M–P), 50 μm. (I–L), 100 μm. EXPRESSION / LABELING:
PHENOTYPE:
|
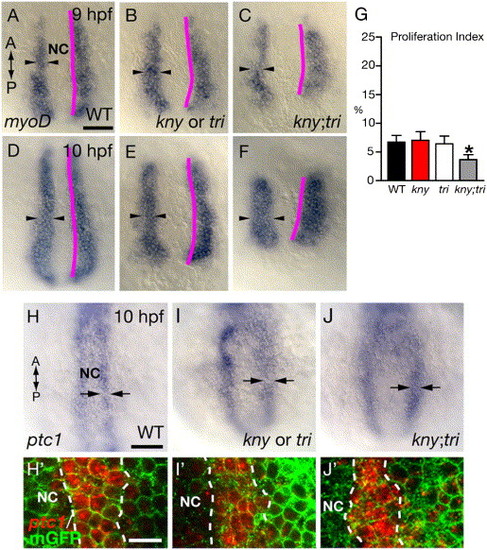
C&E movements define the number of prospective adaxial cells specified during gastrulation. (A–F) myoD RNA expression in the prospective adaxial cells. Purple lines delineate the interface between the axial and presomitic tissues. Arrowheads show the ML width of the myoD-expression domain. (G) Proliferation indices of the prospective adaxial cells (number of proliferating myoD-expressing cells/total number of myoD-expressing cells) at the tailbud stage (10 hpf). 10 embryos of each genotype were analyzed. Error bars represent the standard error. Asterisk: p < 0.05, kny;tri mutant versus WT. (H–J) ptc1 RNA expression at the tailbud stage. (H′–J′) ptc1 RNA expression (red) detected by fast red staining. (A–F, H–J, H′–J′) Dorsal views. NC, notochord. Scale bars: (A–F, H–J) 100 μm; (H2–J2) 20 μm. EXPRESSION / LABELING:
|
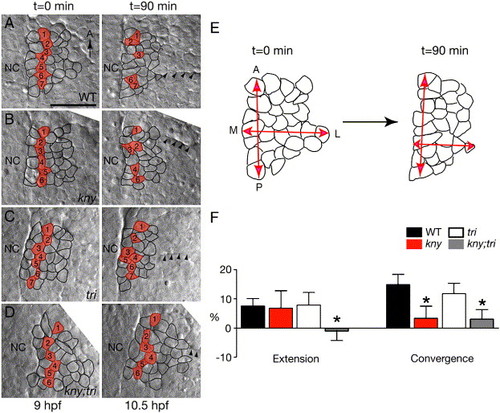
C&E movements of the prospective adaxial cell population during late gastrulation. (A–D) Nomarski images of live embryos captured at the beginning and the end of the time-lapse recordings. Dorsal views, anterior to the top. Cells located two-cell diameters away from the notochord at the beginning of the time-lapse are labeled in red. Their positions at the end of the time-lapses are indicated in the right panels. Arrowheads point to the first somitic boundary. (E) Schematic of the tissue shape change in WT. (F) Quantifications of the tissue shape changes (Materials and methods). Error bars represent the standard error. Asterisk: p < 0.05, mutant versus WT. NC, notochord. M, medial. L, lateral. Scale bar: 50 μm. |

The prospective adaxial cells in kny;tri double mutants fail to maintain their identity during early segmentation. (A–C) MyoD protein distribution detected by the human Myf5 antibody in the embryos also labeled with mGFP. Dashed lines highlight the somite-PSM boundary. (A′–C′) show only the MyoD protein expression. (D–F) At the 10-somite stage, MyoD protein was strongly expressed in one column of adaxial cells flanking the notochord. Weak MyoD expression was detected in the lateral somitic cells at this stage. (D′–F′) At the 10-somite stage, the notochord-adjacent adaxial cells were co-labeled by MyoD and F59 antibodies. Lines in (A′–C′, F′) indicate the somite-PSM boundary. (G) Quantification of the numbers of cells expressing MyoD protein at the 5-somite stage and cells co-labeled with MyoD and F59 antibodies at the 10-somite stage. Error bars represent standard deviation. (H–K) Cell tracing analyses of the prospective adaxial cell population. (H) Within the fluorescein-labeled cell population (red) in WT embryos (n = 6), only one column of cells immediately next to the notochord expressed MyoD protein at the 5-somite stage. (I) The notochord-adjacent cells continued to strongly express MyoD protein at the 10-somite stage. (J) In the double mutants (n = 6), at the 5-somite stage, majority of the fluorescein-labeled cells expressed MyoD. (K) At the 10-somite stage, only the column of cells flanking the notochord exhibit adaxial cell identity. (A–F, H–K) Dorsal views. NC, notochord. Scale bars: (A–F, A′–F′), 50 μm; (H–K) 20 μm. EXPRESSION / LABELING:
|

The range of Hh signaling in the PSM declines during early segmentation. (A–C, A′–C′) ptc1 RNA expression was restricted to one column of cells next to the notochord at the 5-somite stage in WT (A, A′), individual (B, B′), and kny;tri double mutants (C, C′). Arrows show the ML range of the ptc1 expression. (D–F) Labeling of MyoD and F59 antibodies in embryos injected with 100 pg synthetic shh RNA to induce ectopic Shh activity. (G–I) In WT, individual mutants and double mutants, injection of 150 pg shh RNA caused strong MyoD protein expression throughout the somite at the 10-somite stage. (G′–I′) Transverse sections of day1-embryos injected with 150 pg shh RNA and labeled with F59 antibody. (J) Numbers of MyoD-expressing cells at the 5-somite stage and numbers of cells co-labeled by MyoD and F59 antibodies at the 10-somite stage in embryos injected with 100 pg shh RNA. For each genotype, 10 embryos were examined at both stages and quantifications were all done within the 3rd somite. Error bars represent the standard deviation. (A–I) Dorsal views. NC, notochord. Scale bars: (A–C, G′–I′) 100 μm, (A′–C′) 20 μm, (D–I) 50 μm. |

Cell autonomy of Kny and Tri in adaxial cell specification and convergence movements of the PSM. Cells from WT (green) and tri MO-injected kny mutant embryos (red) were co-transplanted into the WT (A–D) or kny;tri-deficient (E–F) host embryos (Materials and methods). (A–F) Confocal images of the host embryos stained with β-catenin antibody at 11.5 hpf. (A–B) When located next to the notochord in the WT hosts, the kny;tri-deficient donor cells formed adaxial cells that exhibited the characteristic epithelial-like morphology. (C–D) In the WT hosts, the WT donor cells were located more medially than the kny;tri-deficient donor cells. (E–F) In the kny;tri-deficient hosts, the WT donor cells were intermingled with the mutant donor cells. In (C–F), the horizontal dashed lines show the ML range of the transplanted donor cell population. The vertical dashed lines separate the donor cell population into the medial and lateral halves. (A–F) Dorsal views. NC, notochord. Scale bar: 20 μm. (G) Quantification of the proportions of WT and kny;tri-deficient donor cells that are located in the medial half of the transplanted donor cell population. Data from 5 WT and 5 kny;tri deficient host embryos are shown. Each host embryo contains on average of 43 WT donor cells and 38 mutant donor cells. |
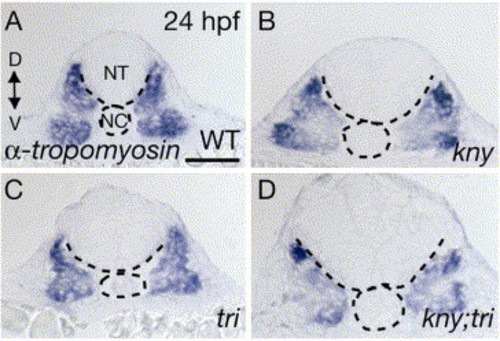
Fast muscle development in kny;tri double mutants. (A-D) α-tropomyosin is mainly expressed in the fast muscle component of the myotome in embryos at 24 hpf (Xu et al., 2000). Its expression was reduced and irregular in the double mutants (D). (A-D) Transverse sections. NT, neural tube. NC, notochord. D, dorsal. V, ventral. Scale bar, 100 μm. |
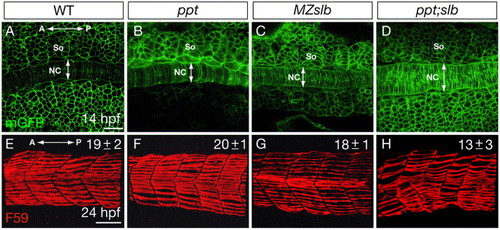
Fig. S2. The somite morphology and slow muscle development in the non-canonical Wnt/PCP mutants. (A-D) Confocal images of the embryos expressing mGFP at the 10-somite stage, dorsal views. (E-H) Lateral views of day1-embryos stained with F59 antibody that labels the slow muscle fibers. The numbers of slow muscle fibers per somite are indicated in the up right corner. All the measurements were done in the 3rd and 4th myotomes.10 embryos were analyzed for each genotype. NC, notochord. So, somite. A, anterior. P, posterior. Scale bar, 50 μm. PHENOTYPE:
|
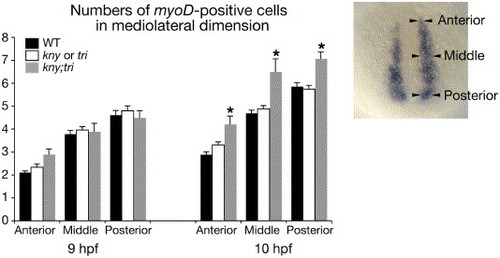
Fig. S3. Numbers of myoD-expressing cells along the mediolateral (ML) dimension at 95% epiboly (9 hpf) and the tailbud stage (10 hpf). The positions where the numbers of myoD-positive cells were counted are indicated on the right. The ML range of the myoD RNA expression in kny;tri double mutants is comparable to WT at 95% epiboly, but becomes significantly wider than WT at the tailbud stage. 34 WT, 24 kny or tri individual mutants, and 10 kny;tri double mutants were examined at 95% epiboly. 39 WT, 43 individual mutants, and 9 double mutants were examined at the tailbud stage. Error bars represent the standard deviation. Asterisks indicate values significantly different at p<0.05. |

Unillustrated author statements PHENOTYPE:
|
Reprinted from Developmental Biology, 304(1), Yin, C., and Solnica-Krezel, L., Convergence and extension movements mediate the specification and fate maintenance of zebrafish slow muscle precursors, 141-155, Copyright (2007) with permission from Elsevier. Full text @ Dev. Biol.