
|
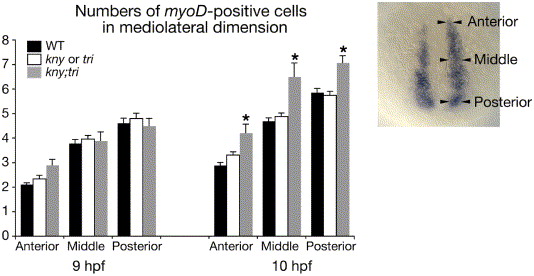
Fig. S3 Fig. S3. Numbers of myoD-expressing cells along the mediolateral (ML) dimension at 95% epiboly (9 hpf) and the tailbud stage (10 hpf). The positions where the numbers of myoD-positive cells were counted are indicated on the right. The ML range of the myoD RNA expression in kny;tri double mutants is comparable to WT at 95% epiboly, but becomes significantly wider than WT at the tailbud stage. 34 WT, 24 kny or tri individual mutants, and 10 kny;tri double mutants were examined at 95% epiboly. 39 WT, 43 individual mutants, and 9 double mutants were examined at the tailbud stage. Error bars represent the standard deviation. Asterisks indicate values significantly different at p<0.05.
Reprinted from Developmental Biology, 304(1), Yin, C., and Solnica-Krezel, L., Convergence and extension movements mediate the specification and fate maintenance of zebrafish slow muscle precursors, 141-155, Copyright (2007) with permission from Elsevier. Full text @ Dev. Biol.