
Fig. 3
|
Fig. 3
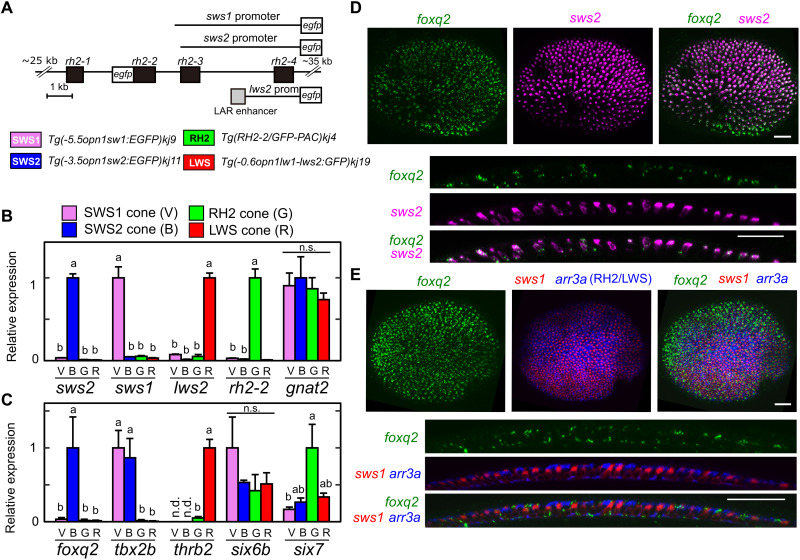
(A) Schematic drawing of transgenes for the four transgenic lines each expressing EGFP in SWS1 (V), SWS2 (B), RH2 (G), or LWS (R) cone subtype. See also Materials and Methods. (B and C) Relative expression levels of cone opsin genes (B) and transcription factors (C) among isolated cone subtypes at the adult stage. Mean expression values with SEM (n = 3) are indicated as bars. Distinct letters indicate statistically significant differences (P < 0.05 by Tukey’s multiple comparisons test). n.s., not significant. (D and E) Expression pattern of foxq2 in 3-dpf larval eyes examined by in situ HCR. The foxq2 expression is covisualized with sws2 (D) or with sws1 and arr3a (E). The bottom image is an orthogonal view of the top z-projected image. Scale bars, 25 μm.