
FIGURE
Fig. 9
Fig. 9
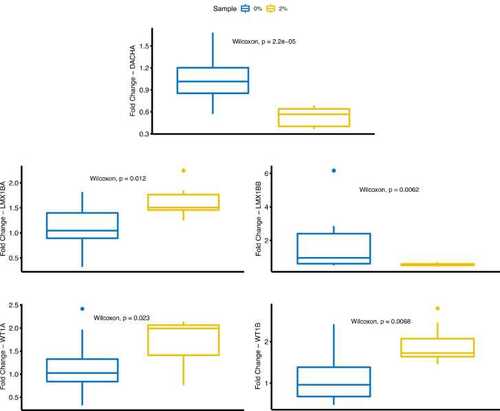
Expression of key TF genes in hyperglycemia-induced zebrafish model. Expression levels of key TF genes (A) dach1a, (B) lmx1ba, (C) lmx1bb, (D) wt1a and (E) wt1b were determined using quantitative real-time PCR and normalized to the internal control gene (eefa1), and relative expression was calibrated using the mean expression of control samples. Data are expressed as mean± SEM. Groups were 0% glucose and 2% glucose conditions. |
Expression Data
| Genes: | |
|---|---|
| Fish: | |
| Condition: | |
| Anatomical Term: | |
| Stage: | Protruding-mouth |
Expression Detail
Antibody Labeling
Phenotype Data
| Fish: | |
|---|---|
| Condition: | |
| Observed In: | |
| Stage: | Protruding-mouth |
Phenotype Detail
Acknowledgments
This image is the copyrighted work of the attributed author or publisher, and
ZFIN has permission only to display this image to its users.
Additional permissions should be obtained from the applicable author or publisher of the image.
Full text @ Comput Struct Biotechnol J