
- Title
-
Network-based identification and prioritization of key transcriptional factors of diabetic kidney disease
- Authors
- Ahmed, I., Ziab, M., Da'as, S., Hasan, W., Jeya, S.P., Aliyev, E., Nisar, S., Bhat, A.A., Fakhro, K.A., Alshabeeb Akil, A.S.
- Source
- Full text @ Comput Struct Biotechnol J
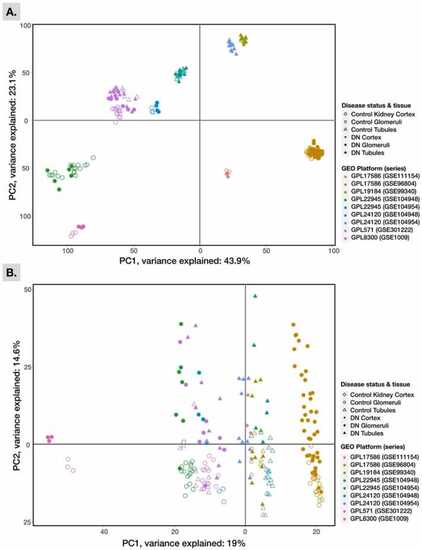
PCA of control and DN human kidney tissue datasets. Shown are the first two most variance-explaining principal components (PC) of RMA/log2-normalized and gene-level-averaged gene expression across all datasets (A) before or (B) after adjusting for batch-effects. |
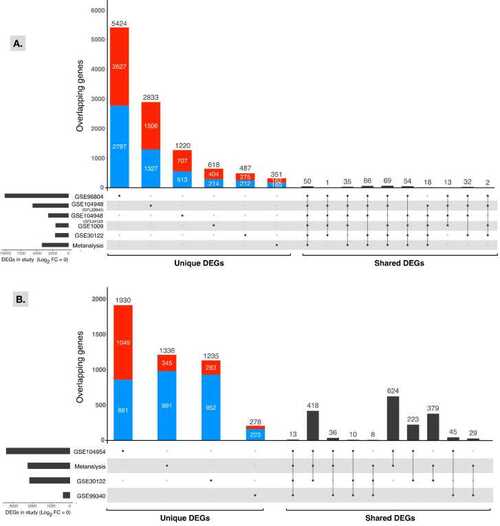
UpSetR plot of unique and shared DEGs among individual datasets. The number of total DEGs in each target glomerulus (A) and tubules (B) dataset is shown on the left side of the figure, and the left side of the figure shows the number of DEGs unique to each study, followed by the top 10 shared gene sets. Directionality of gene expression for unique genes is represented by red for upregulated genes and blue for downregulated genes. |
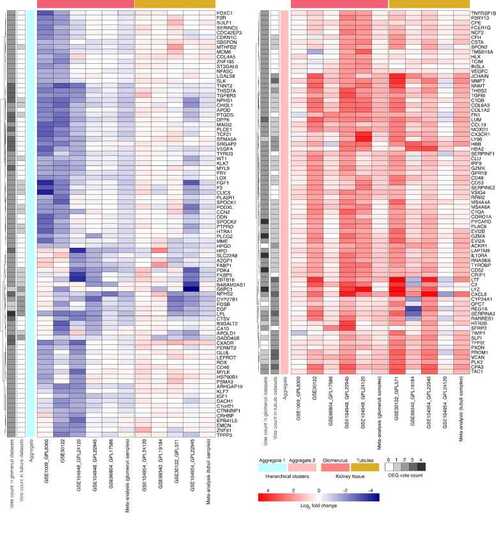
Heatmap of core DEGs human DN kidney tissue samples compared with healthy controls. To simplify visualization, the groups branching from the first hierarchical cluster dendrogram were split and situated side-by-side, labeled “Aggregate 1″ and “Aggregate 2″. The vote counts represent the number of times a gene was significantly down- or up-regulated (Log2 FC = 1.5, FDR<0.05). |
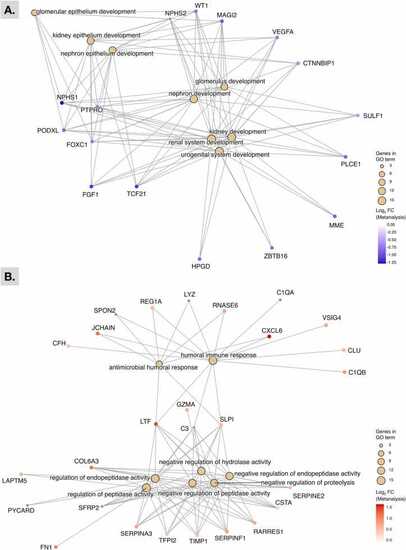
Gene-concept network plot comparing the functional profiles of DEGs in human DN kidney tissue samples compared with healthy controls. Shown are the top 8 gene-ontology terms assigned to genes from the first/downregulated (A) and second/upregulated (B) hierarchical cluster groups produced in |
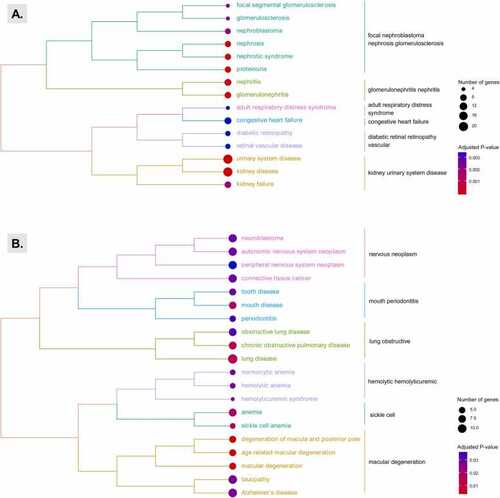
Tree plot of hierarchical clustering groups of disease ontology semantic and enrichment analysis terms for core DEGs. Each tree was created using the core DEGs defined and identified in the meta-analysis from Aggregate 1 (top) and Aggregate 2 (bottom). |
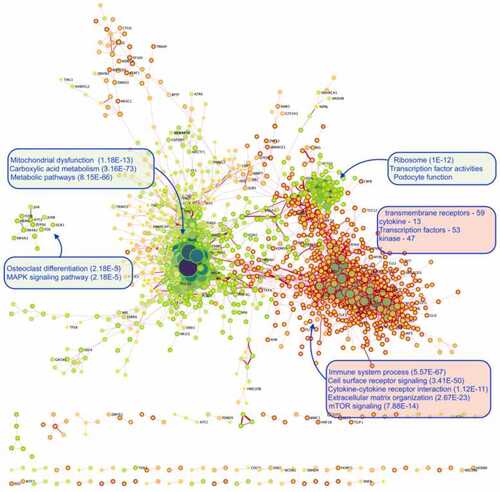
Overall network model using the most significant MI scores visualized by means of a force-directed layout, revealing several clusters in the network. The most prominent biological functions were used to annotate the clusters. Nodes in the network represent the genes, and edges (lines) represent the correlations, measured as mutual information values. Each node border color represents the fold-change in the gene expression in DN conditions. The node size represents the connection to other genes (hubs), and the thickness of the edges represents the strength of the association between genes. |
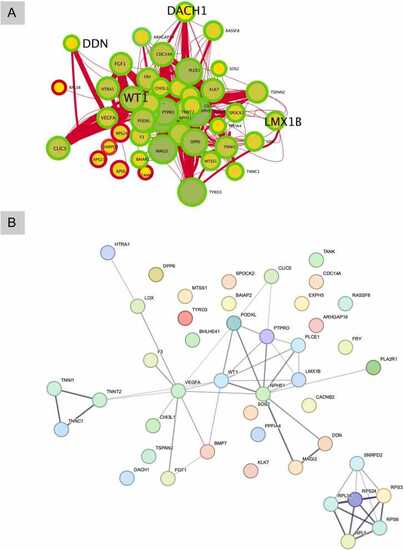
Network clustering of podocyte-differentiation-related differentially expressed genes in human DN kidney tissue compared with healthy controls. The size of each circle is proportional to the number of gene interactions, and the thickness of the edges represents mutual information between genes (A). Network cluster enriched for podocyte function with TFs in bold text. The interactions between the genes were also confirmed by STRING network (B). |
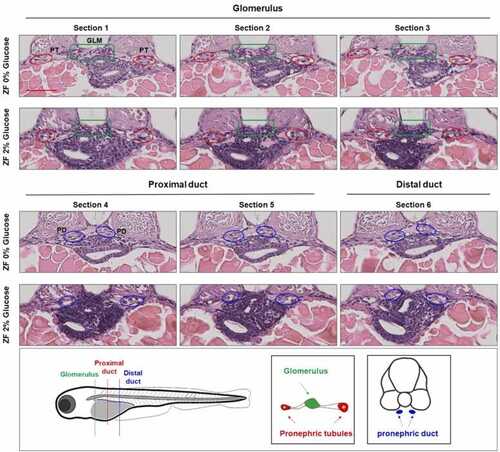
Hyperglycemia-induced pronephric abnormalities in zebrafish model. Representative micrographs from the level of the glomerulus ( PHENOTYPE:
|
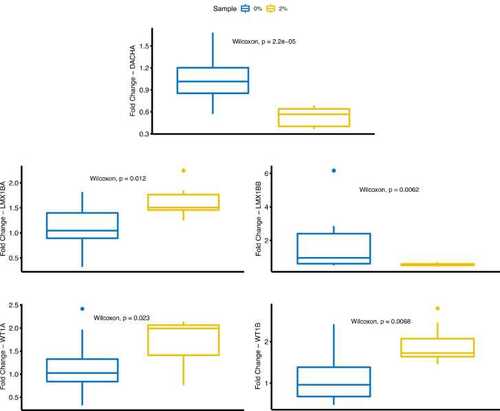
Expression of key TF genes in hyperglycemia-induced zebrafish model. Expression levels of key TF genes (A) dach1a, (B) lmx1ba, (C) lmx1bb, (D) wt1a and (E) wt1b were determined using quantitative real-time PCR and normalized to the internal control gene (eefa1), and relative expression was calibrated using the mean expression of control samples. Data are expressed as mean± SEM. Groups were 0% glucose and 2% glucose conditions. EXPRESSION / LABELING:
PHENOTYPE:
|